Accessing remote data stored on the cloud#
In this tutorial, we’ll cover the following:
Finding a cloud hosted Zarr archive of CMIP6 dataset(s)
Remote data access to a single CMIP6 dataset (sea surface height)
Calculate future predicted sea level change in 2100 compared to 2015
import gcsfs
import pandas as pd
import xarray as xr
Finding cloud native data#
Cloud-native data means data that is structured for efficient querying across the network. Typically, this means having metadata that describes the entire file in the header of the file, or having a a separate pointer file (so that there is no need to download everything first).
Quite commonly, you’ll see cloud-native datasets stored on these three object storage providers, though there are many other ones too.
Getting cloud hosted CMIP6 data#
The Coupled Model Intercomparison Project Phase 6 (CMIP6) dataset is a rich archive of modelling experiments carried out to predict the climate change impacts. The datasets are stored using the Zarr format, and we’ll go over how to access it.
Sources:
CMIP6 data hosted on Google Cloud - https://console.cloud.google.com/marketplace/details/noaa-public/cmip6
Pangeo/ESGF Cloud Data Access tutorial - https://pangeo-data.github.io/pangeo-cmip6-cloud/accessing_data.html
First, let’s open a CSV containing the list of CMIP6 datasets available
df = pd.read_csv("https://cmip6.storage.googleapis.com/pangeo-cmip6.csv")
print(f"Number of rows: {len(df)}")
df.head()
Number of rows: 514818
| activity_id | institution_id | source_id | experiment_id | member_id | table_id | variable_id | grid_label | zstore | dcpp_init_year | version | |
|---|---|---|---|---|---|---|---|---|---|---|---|
| 0 | HighResMIP | CMCC | CMCC-CM2-HR4 | highresSST-present | r1i1p1f1 | Amon | ps | gn | gs://cmip6/CMIP6/HighResMIP/CMCC/CMCC-CM2-HR4/... | NaN | 20170706 |
| 1 | HighResMIP | CMCC | CMCC-CM2-HR4 | highresSST-present | r1i1p1f1 | Amon | rsds | gn | gs://cmip6/CMIP6/HighResMIP/CMCC/CMCC-CM2-HR4/... | NaN | 20170706 |
| 2 | HighResMIP | CMCC | CMCC-CM2-HR4 | highresSST-present | r1i1p1f1 | Amon | rlus | gn | gs://cmip6/CMIP6/HighResMIP/CMCC/CMCC-CM2-HR4/... | NaN | 20170706 |
| 3 | HighResMIP | CMCC | CMCC-CM2-HR4 | highresSST-present | r1i1p1f1 | Amon | rlds | gn | gs://cmip6/CMIP6/HighResMIP/CMCC/CMCC-CM2-HR4/... | NaN | 20170706 |
| 4 | HighResMIP | CMCC | CMCC-CM2-HR4 | highresSST-present | r1i1p1f1 | Amon | psl | gn | gs://cmip6/CMIP6/HighResMIP/CMCC/CMCC-CM2-HR4/... | NaN | 20170706 |
Over 5 million rows! Let’s filter it down to the variable and experiment we’re interested in, e.g. sea surface height.
For the variable_id, you can look it up given some keyword at
https://docs.google.com/spreadsheets/d/1UUtoz6Ofyjlpx5LdqhKcwHFz2SGoTQV2_yekHyMfL9Y
For the experiment_id, download the spreadsheet from
ES-DOC/esdoc-docs,
go to the ‘experiment’ tab, and find the one you’re interested in.
Another good place to find the right model runs is https://esgf-node.llnl.gov/search/cmip6 (once you get your head around the acronyms and short names).
Below, we’ll filter to CMIP6 experiments matching:
Sea Surface Height Above Geoid [m] (variable_id:
zos)Shared Socioeconomic Pathway 5 (experiment_id:
ssp585)
df_zos = df.query("variable_id == 'zos' & experiment_id == 'ssp585'")
df_zos
| activity_id | institution_id | source_id | experiment_id | member_id | table_id | variable_id | grid_label | zstore | dcpp_init_year | version | |
|---|---|---|---|---|---|---|---|---|---|---|---|
| 12081 | ScenarioMIP | NOAA-GFDL | GFDL-ESM4 | ssp585 | r1i1p1f1 | Omon | zos | gn | gs://cmip6/CMIP6/ScenarioMIP/NOAA-GFDL/GFDL-ES... | NaN | 20180701 |
| 12082 | ScenarioMIP | NOAA-GFDL | GFDL-ESM4 | ssp585 | r1i1p1f1 | Omon | zos | gr | gs://cmip6/CMIP6/ScenarioMIP/NOAA-GFDL/GFDL-ES... | NaN | 20180701 |
| 45176 | ScenarioMIP | AWI | AWI-CM-1-1-MR | ssp585 | r1i1p1f1 | Omon | zos | gn | gs://cmip6/CMIP6/ScenarioMIP/AWI/AWI-CM-1-1-MR... | NaN | 20181218 |
| 54265 | ScenarioMIP | CNRM-CERFACS | CNRM-CM6-1 | ssp585 | r1i1p1f2 | Omon | zos | gn | gs://cmip6/CMIP6/ScenarioMIP/CNRM-CERFACS/CNRM... | NaN | 20190219 |
| 69190 | ScenarioMIP | CNRM-CERFACS | CNRM-CM6-1 | ssp585 | r4i1p1f2 | Omon | zos | gn | gs://cmip6/CMIP6/ScenarioMIP/CNRM-CERFACS/CNRM... | NaN | 20190410 |
| ... | ... | ... | ... | ... | ... | ... | ... | ... | ... | ... | ... |
| 497517 | ScenarioMIP | MIROC | MIROC-ES2L | ssp585 | r2i1p1f2 | Omon | zos | gr1 | gs://cmip6/CMIP6/ScenarioMIP/MIROC/MIROC-ES2L/... | NaN | 20201222 |
| 497957 | ScenarioMIP | MIROC | MIROC-ES2L | ssp585 | r10i1p1f2 | Omon | zos | gn | gs://cmip6/CMIP6/ScenarioMIP/MIROC/MIROC-ES2L/... | NaN | 20201222 |
| 497958 | ScenarioMIP | MIROC | MIROC-ES2L | ssp585 | r10i1p1f2 | Omon | zos | gr1 | gs://cmip6/CMIP6/ScenarioMIP/MIROC/MIROC-ES2L/... | NaN | 20201222 |
| 502853 | ScenarioMIP | EC-Earth-Consortium | EC-Earth3-CC | ssp585 | r1i1p1f1 | Omon | zos | gn | gs://cmip6/CMIP6/ScenarioMIP/EC-Earth-Consorti... | NaN | 20210113 |
| 505073 | ScenarioMIP | CMCC | CMCC-ESM2 | ssp585 | r1i1p1f1 | Omon | zos | gn | gs://cmip6/CMIP6/ScenarioMIP/CMCC/CMCC-ESM2/ss... | NaN | 20210126 |
272 rows × 11 columns
There’s 272 modelled scenarios for SSP5. Let’s just get the URL to the first one in the list for now.
print(df_zos.zstore.iloc[0])
gs://cmip6/CMIP6/ScenarioMIP/NOAA-GFDL/GFDL-ESM4/ssp585/r1i1p1f1/Omon/zos/gn/v20180701/
Reading from the remote Zarr storage#
In many cases, you’ll need to first connect to the cloud provider. The CMIP6 dataset allows anonymous access, but for some cases, you may need to authenticate.
fs = gcsfs.GCSFileSystem(token="anon")
Next, we’ll need a mapping to the Google Storage object.
This can be done using fs.get_mapper.
A more generic way (for other cloud providers) is to use
fsspec.get_mapper instead.
store = fs.get_mapper(
    "gs://cmip6/CMIP6/ScenarioMIP/NOAA-GFDL/GFDL-ESM4/ssp585/r1i1p1f1/Omon/zos/gn/v20180701/"
)
With that, we can open the Zarr store like so.
ds = xr.open_zarr(store=store, consolidated=True)
ds
<xarray.Dataset> Size: 2GB
Dimensions:    (bnds: 2, y: 576, x: 720, vertex: 4, time: 1032)
Coordinates:
  * bnds       (bnds) float64 16B 1.0 2.0
    lat        (y, x) float32 2MB dask.array<chunksize=(576, 720), meta=np.ndarray>
    lat_bnds   (y, x, vertex) float32 7MB dask.array<chunksize=(576, 720, 4), meta=np.ndarray>
    lon        (y, x) float32 2MB dask.array<chunksize=(576, 720), meta=np.ndarray>
    lon_bnds   (y, x, vertex) float32 7MB dask.array<chunksize=(576, 720, 4), meta=np.ndarray>
  * time       (time) object 8kB 2015-01-16 12:00:00 ... 2100-12-16 12:00:00
    time_bnds  (time, bnds) object 17kB dask.array<chunksize=(1032, 2), meta=np.ndarray>
  * x          (x) float64 6kB -299.8 -299.2 -298.8 -298.2 ... 58.75 59.25 59.75
  * y          (y) float64 5kB -77.91 -77.72 -77.54 -77.36 ... 89.47 89.68 89.89
Dimensions without coordinates: vertex
Data variables:
    zos        (time, y, x) float32 2GB dask.array<chunksize=(61, 576, 720), meta=np.ndarray>
Attributes: (12/49)
    Conventions:            CF-1.7 CMIP-6.0 UGRID-1.0
    activity_id:            ScenarioMIP
    branch_method:          standard
    branch_time_in_child:   60225.0
    branch_time_in_parent:  60225.0
    comment:                <null ref>
    ...                     ...
    tracking_id:            hdl:21.14100/328fd441-31bb-474f-8fd1-7e3420b72524...
    variable_id:            zos
    variant_info:           N/A
    variant_label:          r1i1p1f1
    netcdf_tracking_ids:    hdl:21.14100/328fd441-31bb-474f-8fd1-7e3420b72524...
version_id: v20180701Selecting time slices#
Let’s say we want to calculate sea level change between
2015 and 2100. We can access just the specific time points
needed using xr.Dataset.sel.
zos_2015jan = ds.zos.sel(time="2015-01-16").squeeze()
zos_2100dec = ds.zos.sel(time="2100-12-16").squeeze()
Sea level change would just be 2100 minus 2015.
sealevelchange = zos_2100dec - zos_2015jan
Note that up to this point, we have not actually downloaded any (big) data yet from the cloud. This is all working based on metadata only.
To bring the data from the cloud to your local computer, call .compute.
This will take a while depending on your connection speed.
sealevelchange = sealevelchange.compute()
We can do a quick plot to show how Sea Level is predicted to change between 2015-2100 (from one modelled experiment).
sealevelchange.plot.imshow()
<matplotlib.image.AxesImage at 0x7f700ddebfd0>
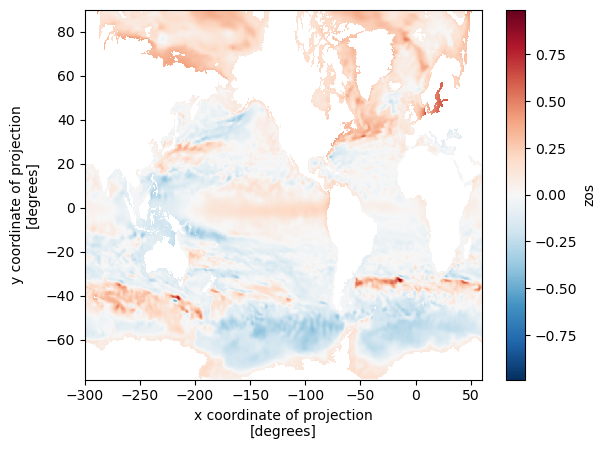
Notice the blue parts between -40 and -60 South where sea level has dropped? That’s to do with the Antarctic ice sheet losing mass and resulting in a lower gravitational pull, resulting in a relative decrease in sea level. Over most of the Northern Hemisphere though, sea level rise has increased between 2015 and 2100.
That’s all! Hopefully this will get you started on accessing more cloud-native datasets!