Xarray Fundamentals#
Learning Objectives#
Provide an overview of xarray
Describe the core xarray data structures, the DataArray and the Dataset, and the components that make them up
Load xarray dataset from a netCDF file
View and set attributes
What Is Xarray?#
Unlabeled, N-dimensional arrays of numbers (e.g., NumPy’s ndarray) are the most widely used data structure in scientific computing. However, they lack a meaningful representation of the metadata associated with their data. Implementing such functionality is left to individual users and domain-specific packages.
xarray expands on the capabilities of NumPy arrays, providing a lot of streamline data manipulation.
Xarray’s interface is based largely on the netCDF data model (variables, attributes, and dimensions), but it goes beyond the traditional netCDF interfaces to provide functionality similar to netCDF-java’s Common Data Model (CDM).
xarray is motivated by weather and climate use cases but is domain agnostic…
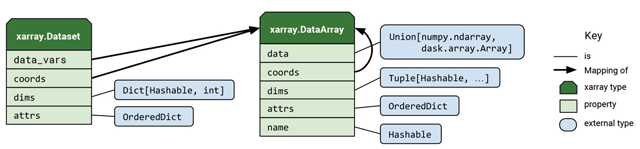
Core Data Structures#
xarray has 2 fundamental data structures:
DataArray, which holds single multi-dimensional variables and its coordinatesDataset, which holds multiple variables that potentially share the same coordinates
Loading data from netCDF#
NetCDF (network Common Data Form) is a file format for storing multidimensional array data
NetCDF is a self-describing, meaning that a netCDF file includes information about the data it contains, and the necessary metadata such as coordinate system used, attributes describing the data, etc…
NetCDF is used extensively in the geoscience communities
Xarray’s interface is based largely on the netCDF data model
Learn more about netCDF here.
import xarray as xr

%config InlineBackend.figure_format='retina'
# Load mean sea surface temperature dataset
ds = xr.open_dataset("../../data/sst.mnmean.nc", engine="netcdf4")

# xarray's HTML representation
ds
<xarray.Dataset> Size: 8MB
Dimensions:  (lat: 89, lon: 180, time: 128)
Coordinates:
  * lat      (lat) float32 356B 88.0 86.0 84.0 82.0 ... -82.0 -84.0 -86.0 -88.0
  * lon      (lon) float32 720B 0.0 2.0 4.0 6.0 8.0 ... 352.0 354.0 356.0 358.0
  * time     (time) datetime64[ns] 1kB 2010-01-01 2010-02-01 ... 2020-08-01
Data variables:
    sst      (time, lat, lon) float32 8MB ...
Attributes: (12/37)
    climatology:               Climatology is based on 1971-2000 SST, Xue, Y....
    description:               In situ data: ICOADS2.5 before 2007 and NCEP i...
    keywords_vocabulary:       NASA Global Change Master Directory (GCMD) Sci...
    keywords:                  Earth Science > Oceans > Ocean Temperature > S...
    instrument:                Conventional thermometers
    source_comment:            SSTs were observed by conventional thermometer...
    ...                        ...
    creator_url_original:      https://www.ncei.noaa.gov
    license:                   No constraints on data access or use
    comment:                   SSTs were observed by conventional thermometer...
    summary:                   ERSST.v5 is developed based on v4 after revisi...
    dataset_title:             NOAA Extended Reconstructed SST V5
data_modified: 2020-09-07# If you prefer a text based repr, you can set the display_style='text' by uncommenting the line below
# xr.set_options(display_style="text")
# Look at the netCDF representation
ds.info()
Dataset#
Xarray’s
Datasetis a dict-like container of labeled arrays (DataArrays) with aligned dimensions. - It is designed as an in-memory representation of a netCDF dataset.In addition to the dict-like interface of the dataset itself, which can be used to access any
DataArrayin aDataset. Datasets have the following key properties:
Attribute |
Description |
|---|---|
|
OrderedDict of |
|
dictionary mapping from dimension names to the fixed length of each dimension (e.g., { |
|
a dict-like container of arrays (coordinates) that label each point (e.g., 1-dimensional arrays of numbers, datetime objects or strings) |
|
OrderedDict to hold arbitrary metadata pertaining to the dataset. |
# variables are in our dataset
ds.data_vars
Data variables:
    sst      (time, lat, lon) float32 8MB ...
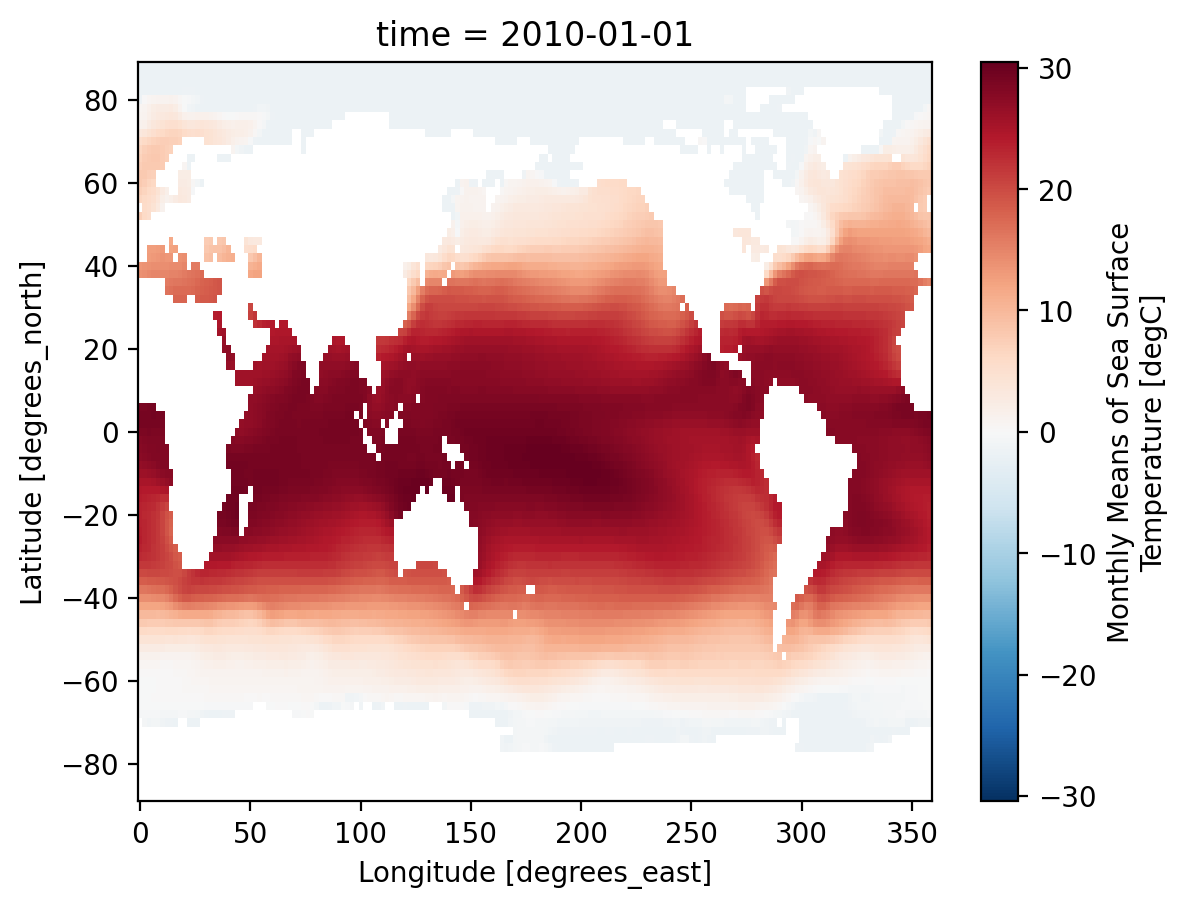
# select one variable and pick the first entry along the first axis (time)
ds.sst[0]
<xarray.DataArray 'sst' (lat: 89, lon: 180)> Size: 64kB
[16020 values with dtype=float32]
Coordinates:
  * lat      (lat) float32 356B 88.0 86.0 84.0 82.0 ... -82.0 -84.0 -86.0 -88.0
  * lon      (lon) float32 720B 0.0 2.0 4.0 6.0 8.0 ... 352.0 354.0 356.0 358.0
    time     datetime64[ns] 8B 2010-01-01
Attributes:
    long_name:     Monthly Means of Sea Surface Temperature
    units:         degC
    var_desc:      Sea Surface Temperature
    level_desc:    Surface
    statistic:     Mean
    dataset:       NOAA Extended Reconstructed SST V5
    parent_stat:   Individual Values
    actual_range:  [-1.8     42.32636]
valid_range: [-1.8 45. ]# Plot one timestep
ds.sst[0].plot();
# dataset dimensions
ds.dims
FrozenMappingWarningOnValuesAccess({'lat': 89, 'lon': 180, 'time': 128})
# dataset coordinates
ds.coords
Coordinates:
  * lat      (lat) float32 356B 88.0 86.0 84.0 82.0 ... -82.0 -84.0 -86.0 -88.0
  * lon      (lon) float32 720B 0.0 2.0 4.0 6.0 8.0 ... 352.0 354.0 356.0 358.0
  * time     (time) datetime64[ns] 1kB 2010-01-01 2010-02-01 ... 2020-08-01
# dataset global attributes
ds.attrs
{'climatology': 'Climatology is based on 1971-2000 SST, Xue, Y., T. M. Smith, and R. W. Reynolds, 2003: Interdecadal changes of 30-yr SST normals during 1871.2000. Journal of Climate, 16, 1601-1612.',
 'description': 'In situ data: ICOADS2.5 before 2007 and NCEP in situ data from 2008 to present. Ice data: HadISST ice before 2010 and NCEP ice after 2010.',
 'keywords_vocabulary': 'NASA Global Change Master Directory (GCMD) Science Keywords',
 'keywords': 'Earth Science > Oceans > Ocean Temperature > Sea Surface Temperature >',
 'instrument': 'Conventional thermometers',
 'source_comment': 'SSTs were observed by conventional thermometers in Buckets (insulated or un-insulated canvas and wooded buckets) or Engine Room Intaker',
 'geospatial_lon_min': np.float32(-1.0),
 'geospatial_lon_max': np.float32(359.0),
 'geospatial_laty_max': np.float32(89.0),
 'geospatial_laty_min': np.float32(-89.0),
 'geospatial_lat_max': np.float32(89.0),
 'geospatial_lat_min': np.float32(-89.0),
 'geospatial_lat_units': 'degrees_north',
 'geospatial_lon_units': 'degrees_east',
 'cdm_data_type': 'Grid',
 'project': 'NOAA Extended Reconstructed Sea Surface Temperature (ERSST)',
 'original_publisher_url': 'http://www.ncdc.noaa.gov',
 'References': 'https://www.ncdc.noaa.gov/data-access/marineocean-data/extended-reconstructed-sea-surface-temperature-ersst-v5 at NCEI and http://www.esrl.noaa.gov/psd/data/gridded/data.noaa.ersst.v5.html',
 'source': 'In situ data: ICOADS R3.0 before 2015, NCEP in situ GTS from 2016 to present, and Argo SST from 1999 to present. Ice data: HadISST2 ice before 2015, and NCEP ice after 2015',
 'title': 'NOAA ERSSTv5 (in situ only)',
 'history': "created 07/2017 by PSD data using NCEI's ERSST V5 NetCDF values",
 'institution': 'This version written at NOAA/ESRL PSD: obtained from NOAA/NESDIS/National Centers for Environmental Information and time aggregated. Original Full Source: NOAA/NESDIS/NCEI/CCOG',
 'citation': 'Huang et al, 2017: Extended Reconstructed Sea Surface Temperatures Version 5 (ERSSTv5): Upgrades, Validations, and Intercomparisons. Journal of Climate, https://doi.org/10.1175/JCLI-D-16-0836.1',
 'platform': 'Ship and Buoy SSTs from ICOADS R3.0 and NCEP GTS',
 'standard_name_vocabulary': 'CF Standard Name Table (v40, 25 January 2017)',
 'processing_level': 'NOAA Level 4',
 'Conventions': 'CF-1.6, ACDD-1.3',
 'metadata_link': ':metadata_link = https://doi.org/10.7289/V5T72FNM (original format)',
 'creator_name': 'Boyin Huang (original)',
 'date_created': '2017-06-30T12:18:00Z (original)',
 'product_version': 'Version 5',
 'creator_url_original': 'https://www.ncei.noaa.gov',
 'license': 'No constraints on data access or use',
 'comment': 'SSTs were observed by conventional thermometers in Buckets (insulated or un-insulated canvas and wooded buckets), Engine Room Intakers, or floats and drifters',
 'summary': 'ERSST.v5 is developed based on v4 after revisions of 8 parameters using updated data sets and advanced knowledge of ERSST analysis',
 'dataset_title': 'NOAA Extended Reconstructed SST V5',
 'data_modified': '2020-09-07'}
DataArray#
The DataArray is xarray’s implementation of a labeled, multi-dimensional array. It has several key properties:
Attribute |
Description |
|---|---|
|
|
|
dimension names for each axis. For example:( |
|
a dict-like container of arrays (coordinates) that label each point (e.g., 1-dimensional arrays of numbers, datetime objects or strings) |
|
an |
|
an arbitrary name of the array |
# Extract the sst Variable/DataArray
ds["sst"]  # Equivalent to ds.sst
<xarray.DataArray 'sst' (time: 128, lat: 89, lon: 180)> Size: 8MB
[2050560 values with dtype=float32]
Coordinates:
  * lat      (lat) float32 356B 88.0 86.0 84.0 82.0 ... -82.0 -84.0 -86.0 -88.0
  * lon      (lon) float32 720B 0.0 2.0 4.0 6.0 8.0 ... 352.0 354.0 356.0 358.0
  * time     (time) datetime64[ns] 1kB 2010-01-01 2010-02-01 ... 2020-08-01
Attributes:
    long_name:     Monthly Means of Sea Surface Temperature
    units:         degC
    var_desc:      Sea Surface Temperature
    level_desc:    Surface
    statistic:     Mean
    dataset:       NOAA Extended Reconstructed SST V5
    parent_stat:   Individual Values
    actual_range:  [-1.8     42.32636]
valid_range: [-1.8 45. ]# The actual (numpy) array data
ds.sst.data
# DataArray/Variable dimensions
ds.sst.dims
('time', 'lat', 'lon')
# DataArray/Variable coordinates
ds.sst.coords
Coordinates:
  * lat      (lat) float32 356B 88.0 86.0 84.0 82.0 ... -82.0 -84.0 -86.0 -88.0
  * lon      (lon) float32 720B 0.0 2.0 4.0 6.0 8.0 ... 352.0 354.0 356.0 358.0
  * time     (time) datetime64[ns] 1kB 2010-01-01 2010-02-01 ... 2020-08-01
# DataArray/Variable attributes
ds.sst.attrs
{'long_name': 'Monthly Means of Sea Surface Temperature',
 'units': 'degC',
 'var_desc': 'Sea Surface Temperature',
 'level_desc': 'Surface',
 'statistic': 'Mean',
 'dataset': 'NOAA Extended Reconstructed SST V5',
 'parent_stat': 'Individual Values',
 'actual_range': array([-1.8    , 42.32636], dtype=float32),
 'valid_range': array([-1.8, 45. ], dtype=float32)}
Coordinates vs dimensions#
DataArray objects inside a Dataset may have any number of dimensions but are presumed to share a common coordinate system.
Coordinates can also have any number of dimensions but denote constant/independent quantities, unlike the varying/dependent quantities that belong in data.
A dimension is just a name of an axis, like “time”
ds.dims
FrozenMappingWarningOnValuesAccess({'lat': 89, 'lon': 180, 'time': 128})
ds.coords
Coordinates:
  * lat      (lat) float32 356B 88.0 86.0 84.0 82.0 ... -82.0 -84.0 -86.0 -88.0
  * lon      (lon) float32 720B 0.0 2.0 4.0 6.0 8.0 ... 352.0 354.0 356.0 358.0
  * time     (time) datetime64[ns] 1kB 2010-01-01 2010-02-01 ... 2020-08-01
# extracting a coordinate variable
ds.sst.lon
# extracting a coordinate variable from .coords
ds.coords["time"]
Attributes#
Attributes can be used to store metadata. What metadata should you store? It depends on your domain and your needs
# Look at global attributes
ds.attrs
{'climatology': 'Climatology is based on 1971-2000 SST, Xue, Y., T. M. Smith, and R. W. Reynolds, 2003: Interdecadal changes of 30-yr SST normals during 1871.2000. Journal of Climate, 16, 1601-1612.',
 'description': 'In situ data: ICOADS2.5 before 2007 and NCEP in situ data from 2008 to present. Ice data: HadISST ice before 2010 and NCEP ice after 2010.',
 'keywords_vocabulary': 'NASA Global Change Master Directory (GCMD) Science Keywords',
 'keywords': 'Earth Science > Oceans > Ocean Temperature > Sea Surface Temperature >',
 'instrument': 'Conventional thermometers',
 'source_comment': 'SSTs were observed by conventional thermometers in Buckets (insulated or un-insulated canvas and wooded buckets) or Engine Room Intaker',
 'geospatial_lon_min': np.float32(-1.0),
 'geospatial_lon_max': np.float32(359.0),
 'geospatial_laty_max': np.float32(89.0),
 'geospatial_laty_min': np.float32(-89.0),
 'geospatial_lat_max': np.float32(89.0),
 'geospatial_lat_min': np.float32(-89.0),
 'geospatial_lat_units': 'degrees_north',
 'geospatial_lon_units': 'degrees_east',
 'cdm_data_type': 'Grid',
 'project': 'NOAA Extended Reconstructed Sea Surface Temperature (ERSST)',
 'original_publisher_url': 'http://www.ncdc.noaa.gov',
 'References': 'https://www.ncdc.noaa.gov/data-access/marineocean-data/extended-reconstructed-sea-surface-temperature-ersst-v5 at NCEI and http://www.esrl.noaa.gov/psd/data/gridded/data.noaa.ersst.v5.html',
 'source': 'In situ data: ICOADS R3.0 before 2015, NCEP in situ GTS from 2016 to present, and Argo SST from 1999 to present. Ice data: HadISST2 ice before 2015, and NCEP ice after 2015',
 'title': 'NOAA ERSSTv5 (in situ only)',
 'history': "created 07/2017 by PSD data using NCEI's ERSST V5 NetCDF values",
 'institution': 'This version written at NOAA/ESRL PSD: obtained from NOAA/NESDIS/National Centers for Environmental Information and time aggregated. Original Full Source: NOAA/NESDIS/NCEI/CCOG',
 'citation': 'Huang et al, 2017: Extended Reconstructed Sea Surface Temperatures Version 5 (ERSSTv5): Upgrades, Validations, and Intercomparisons. Journal of Climate, https://doi.org/10.1175/JCLI-D-16-0836.1',
 'platform': 'Ship and Buoy SSTs from ICOADS R3.0 and NCEP GTS',
 'standard_name_vocabulary': 'CF Standard Name Table (v40, 25 January 2017)',
 'processing_level': 'NOAA Level 4',
 'Conventions': 'CF-1.6, ACDD-1.3',
 'metadata_link': ':metadata_link = https://doi.org/10.7289/V5T72FNM (original format)',
 'creator_name': 'Boyin Huang (original)',
 'date_created': '2017-06-30T12:18:00Z (original)',
 'product_version': 'Version 5',
 'creator_url_original': 'https://www.ncei.noaa.gov',
 'license': 'No constraints on data access or use',
 'comment': 'SSTs were observed by conventional thermometers in Buckets (insulated or un-insulated canvas and wooded buckets), Engine Room Intakers, or floats and drifters',
 'summary': 'ERSST.v5 is developed based on v4 after revisions of 8 parameters using updated data sets and advanced knowledge of ERSST analysis',
 'dataset_title': 'NOAA Extended Reconstructed SST V5',
 'data_modified': '2020-09-07'}
# Look at variable specific attributes
ds.sst.attrs
{'long_name': 'Monthly Means of Sea Surface Temperature',
 'units': 'degC',
 'var_desc': 'Sea Surface Temperature',
 'level_desc': 'Surface',
 'statistic': 'Mean',
 'dataset': 'NOAA Extended Reconstructed SST V5',
 'parent_stat': 'Individual Values',
 'actual_range': array([-1.8    , 42.32636], dtype=float32),
 'valid_range': array([-1.8, 45. ], dtype=float32)}
# Set some arbitrary attribute on a data Variable/DataArray
ds.sst.attrs["my_custom_attribute"] = "Foo Bar"
ds.sst.attrs
{'long_name': 'Monthly Means of Sea Surface Temperature',
 'units': 'degC',
 'var_desc': 'Sea Surface Temperature',
 'level_desc': 'Surface',
 'statistic': 'Mean',
 'dataset': 'NOAA Extended Reconstructed SST V5',
 'parent_stat': 'Individual Values',
 'actual_range': array([-1.8    , 42.32636], dtype=float32),
 'valid_range': array([-1.8, 45. ], dtype=float32),
 'my_custom_attribute': 'Foo Bar'}
Going Further#
Xarray Documentation on Data Structures: https://docs.xarray.dev/en/stable/data-structures.html
Xarray Documentation on Reading files and writing files: https://docs.xarray.dev/en/stable/user-guide/io.html
Next: Indexing