Geography with Cartopy#
Since xarray’s default plotting functionality builds on matplotlib, we can seamlessly use cartopy to make nice maps:
Specify a
projectionfor the plot when creating a new figurefigwith axisaxis.Explicitly ask xarray to plot to axis
axisby passing the kwargax=axis.Specify the projection of the data using
transform(PlateCarreehere) in.plot().
import cartopy.crs as ccrs
import matplotlib as mpl
import matplotlib.pyplot as plt
import xarray as xr

%config InlineBackend.figure_format='retina'
ds = xr.tutorial.open_dataset("air_temperature_gradient")
monthly_means = ds.groupby("time.month").mean()
# xarray's groupby reductions drop attributes. Let's assign them back so we get nice labels.
monthly_means.Tair.attrs = ds.Tair.attrs
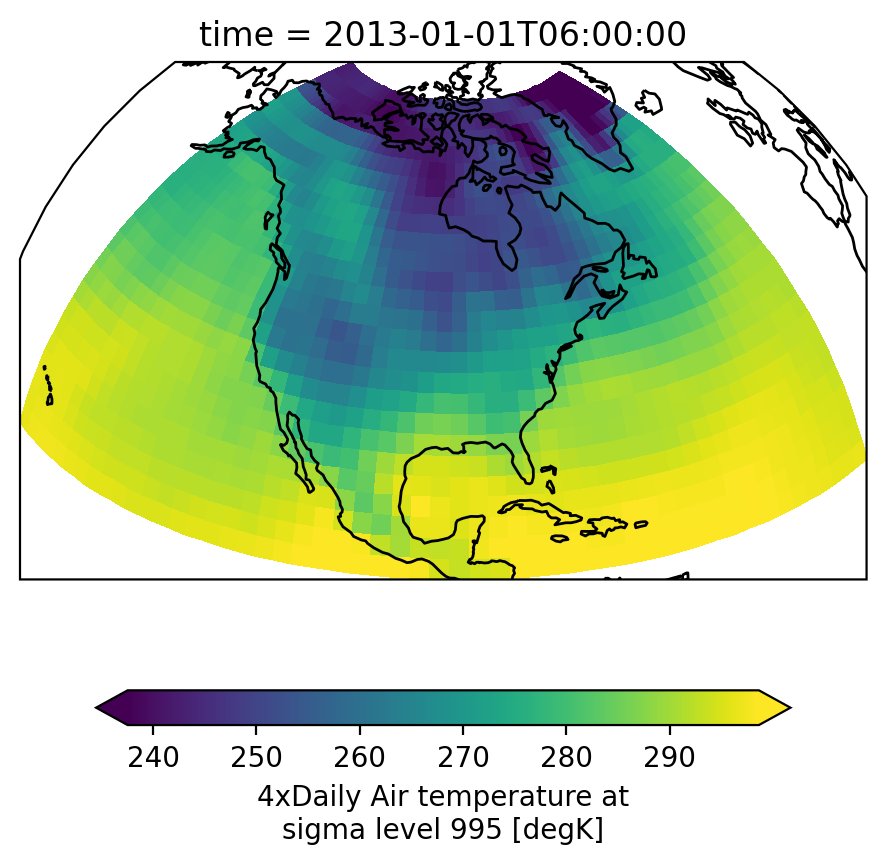
Basic plot#
fig, axis = plt.subplots(1, 1, subplot_kw=dict(projection=ccrs.Orthographic(-90, 30)))

ds.Tair.isel(time=1).plot(
    ax=axis,
    transform=ccrs.PlateCarree(),  # this is important!
    # usual xarray stuff
    cbar_kwargs={"orientation": "horizontal", "shrink": 0.7},
    robust=True,
)
axis.coastlines()  # cartopy function
<cartopy.mpl.feature_artist.FeatureArtist at 0x7fe55e55c3b0>
/home/runner/work/xarray-tutorial/xarray-tutorial/.pixi/envs/default/lib/python3.12/site-packages/cartopy/io/__init__.py:241: DownloadWarning: Downloading: https://naturalearth.s3.amazonaws.com/110m_physical/ne_110m_coastline.zip
  warnings.warn(f'Downloading: {url}', DownloadWarning)
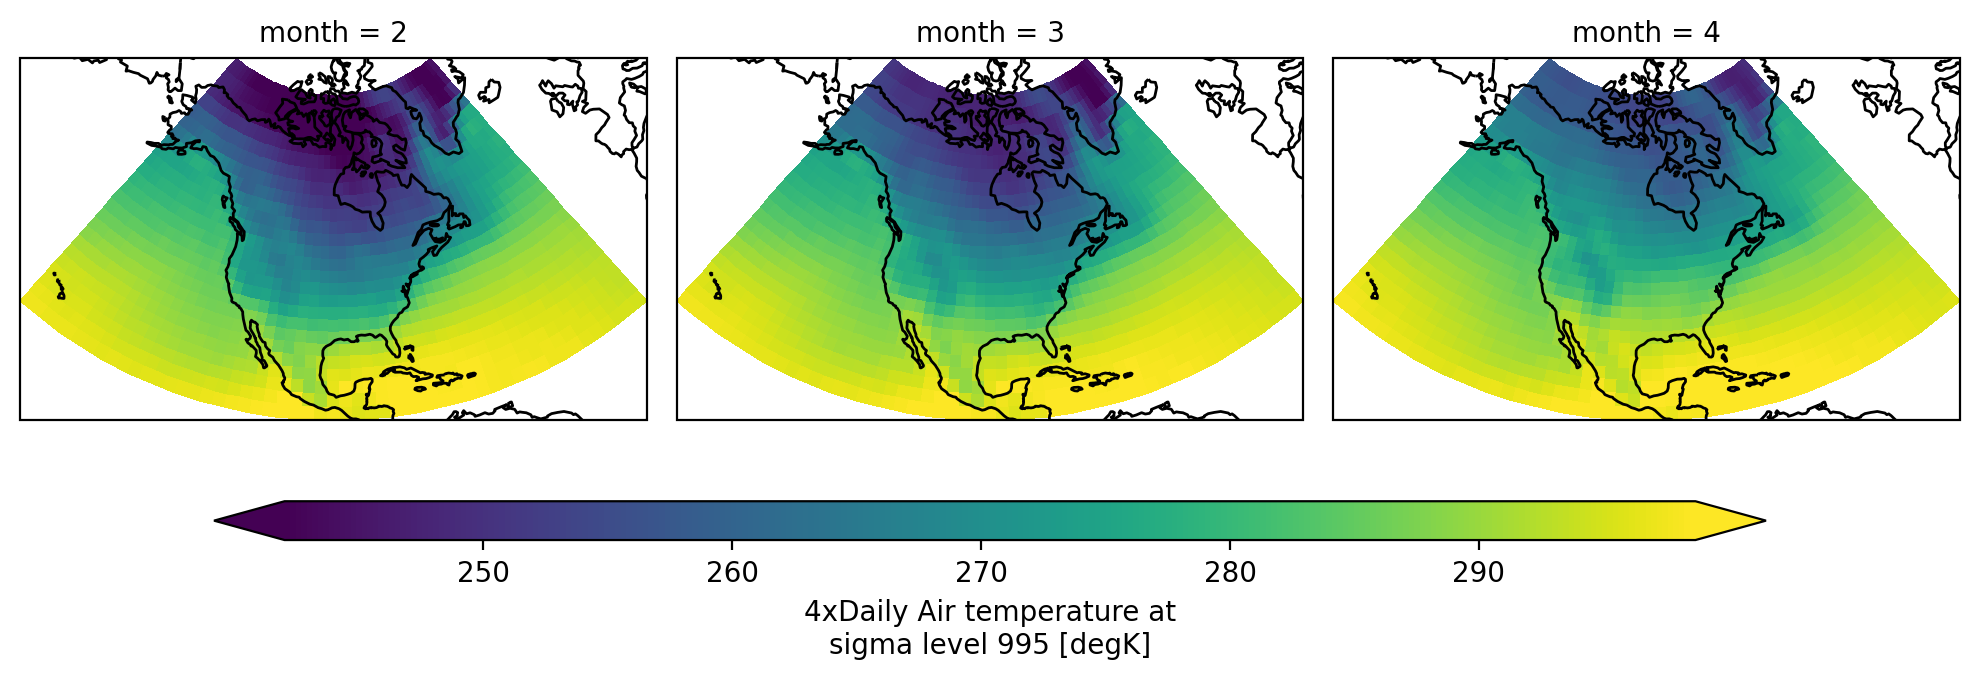
Faceting maps#
We can make faceted maps. Since FacetGrid creates the axes it plots to, we
need to pass the projection kwarg in subplot_kws. This makes sure that the
subplots are set up properly for cartopy.
fg = monthly_means.Tair.isel(month=[1, 2, 3]).plot(
    col="month",
    transform=ccrs.PlateCarree(),  # remember to provide this!
    subplot_kws={"projection": ccrs.LambertConformal(central_longitude=-95, central_latitude=45)},
    cbar_kwargs={"orientation": "horizontal", "shrink": 0.8, "aspect": 40},
    robust=True,
)

# lets add a coastline to each axis
# great reason to use FacetGrid.map
fg.map(lambda: plt.gca().coastlines())
<xarray.plot.facetgrid.FacetGrid at 0x7fe56f5b2810>