Boolean Indexing & Masking#
Learning Objectives#
The concept of boolean masks
Dropping/Masking data using
whereUsing
isinfor creating a boolean mask
Overview#
Boolean masking, known as boolean indexing, is a functionality in Python that enables the filtering of values based on a specific condition.
A boolean mask refers to a binary array or a boolean-valued (True/False) array that is used as a filter to select specific elements from another array. The boolean mask acts as a criterion or condition, where each element in the mask corresponds to an element in the target array. An element in the target array is selected when the corresponding mask value is True.
Xarray provides different capabilities to allow filtering and boolean indexing. In this notebook, we will learn more about it.
First, let’s import the packages needed for this notebook:
import cartopy.crs as ccrs
import matplotlib as mpl
import numpy as np
import xarray as xr
from matplotlib import pyplot as plt

xr.set_options(display_expand_attrs=False)
np.set_printoptions(threshold=10, edgeitems=2)
In this tutorial, we’ll use the Regional Arctic System Mode (RASM) example dataset
ds = xr.tutorial.load_dataset("rasm").isel(time=0)
ds
<xarray.Dataset> Size: 1MB
Dimensions:  (y: 205, x: 275)
Coordinates:
    xc       (y, x) float64 451kB 189.2 189.4 189.6 189.7 ... 17.4 17.15 16.91
    yc       (y, x) float64 451kB 16.53 16.78 17.02 17.27 ... 28.01 27.76 27.51
    time     object 8B 1980-09-16 12:00:00
Dimensions without coordinates: y, x
Data variables:
    Tair     (y, x) float64 451kB nan nan nan nan ... 27.91 27.02 26.56 26.73
Attributes: (11)In this dataset, the logical coordinates are x and y, while the physical coordinates are xc and yc, which represent the latitudes and longitude of the data.
{'long_name': 'longitude of grid cell center', 'units': 'degrees_east'}
{'long_name': 'latitude of grid cell center', 'units': 'degrees_north'}
da = ds.Tair
da
<xarray.DataArray 'Tair' (y: 205, x: 275)> Size: 451kB
array([[        nan,         nan, ...,         nan,         nan],
       [        nan,         nan, ...,         nan,         nan],
       ...,
       [        nan,         nan, ..., 26.80261869, 27.08603517],
       [        nan,         nan, ..., 26.56473862, 26.73064933]],
      shape=(205, 275))
Coordinates:
xc (y, x) float64 451kB 189.2 189.4 189.6 189.7 ... 17.4 17.15 16.91
yc (y, x) float64 451kB 16.53 16.78 17.02 17.27 ... 28.01 27.76 27.51
time object 8B 1980-09-16 12:00:00
Dimensions without coordinates: y, x
Attributes: (4)Masking with where()#
Indexing methods on Xarray objects generally return a subset of the original data. However, it is sometimes useful to select an object with the same shape as the original data, but with some elements masked.
By applying .where(), the original data’s shape is maintained, with values masked based on a Boolean condition. Values that satisfy the condition (True) are returned unchanged, while values that do not meet the condition (False) are replaced with a predefined value.
In the example below, we replace all nan values with -9999:
# Let's replace the missing values (nan) with some placeholder
ds.Tair.where(ds.Tair.notnull(), -9999)
<xarray.DataArray 'Tair' (y: 205, x: 275)> Size: 451kB
array([[-9999.        , -9999.        , ..., -9999.        ,
        -9999.        ],
       [-9999.        , -9999.        , ..., -9999.        ,
        -9999.        ],
       ...,
       [-9999.        , -9999.        , ...,    26.80261869,
           27.08603517],
       [-9999.        , -9999.        , ...,    26.56473862,
           26.73064933]], shape=(205, 275))
Coordinates:
    xc       (y, x) float64 451kB 189.2 189.4 189.6 189.7 ... 17.4 17.15 16.91
    yc       (y, x) float64 451kB 16.53 16.78 17.02 17.27 ... 28.01 27.76 27.51
    time     object 8B 1980-09-16 12:00:00
Dimensions without coordinates: y, x
Attributes: (4)As you can see, in the example above .where() preserved the shape of the original data by masking the values with a boolean condition.
Most uses of .where() check whether or not specific data values are less than or greater than a constant value.
The data values specified in the boolean condition of .where() can be any of the following:
a
DataArraya
Dataseta function
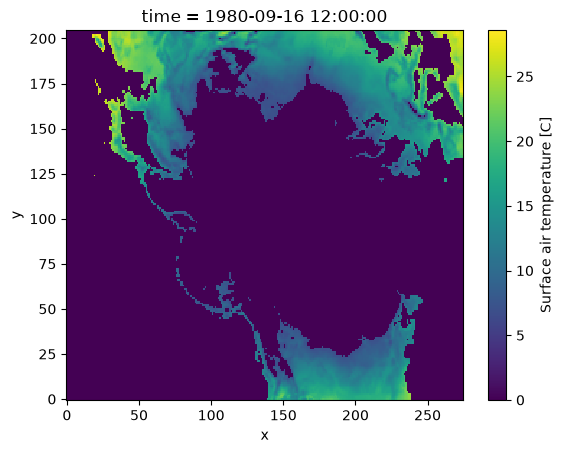
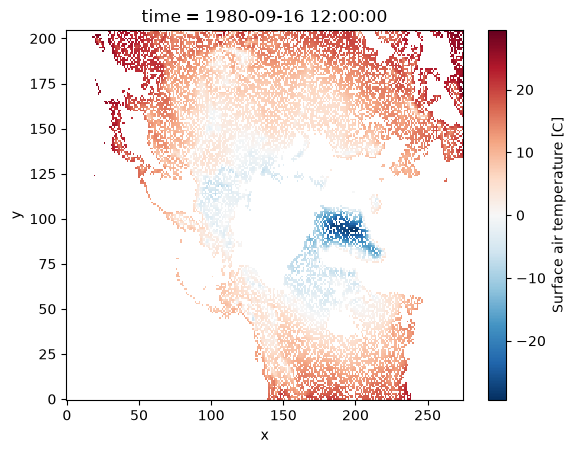
In the following example, we make use of .where() to mask all temperature below 0°C.
da_masked = da.where(da >= 0)

# -- making both plots for comparison:
fig, axes = plt.subplots(ncols=2, figsize=(15, 5))

# -- for reference (without masking):
da.plot(ax=axes[0], vmin=-30, vmax=30, cmap=mpl.cm.RdBu_r)

# -- masked DataArray
da_masked.plot(ax=axes[1], vmin=-30, vmax=30, cmap=mpl.cm.RdBu_r);
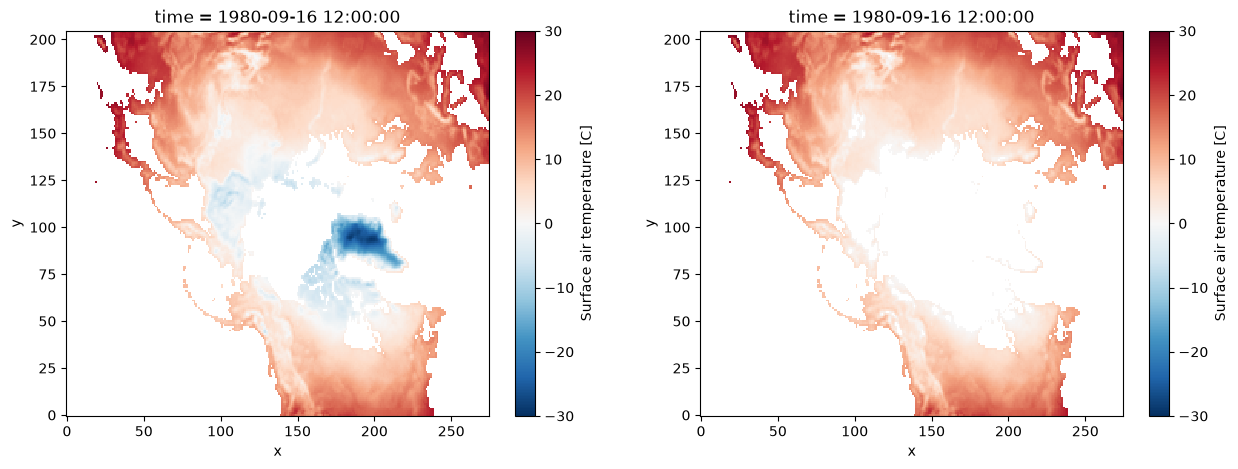
Tip
By default Xarray set the masked values to nan. But as we saw in the first example, we can set it to other values too.
Exercise
Using the syntax you’ve learned so far, mask all the points with latitudes above 60° N.
Solution
da_masked = da.where(da.yc >= 60)
da_masked[:, :].plot();
# write your answer here!
As mentioned above, by default where maintains the original size of the data. You can use the option drop=True to clip coordinate elements that are fully masked:
da_masked = da.where(da.yc > 60, drop=True)
da_masked.plot();
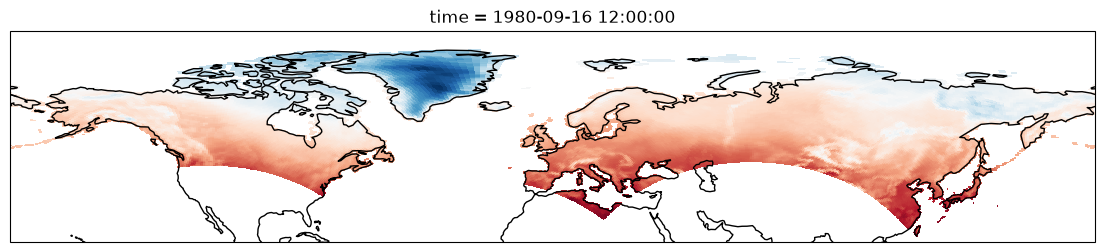
Please note that in this dataset, the variables xc (longitude) and yc (latitude) are two-dimensional scalar fields.
When we plotted the data variable Tair, by default we get the logical coordinates (i.e. x and y) as we show in the example above.
In order to visualize the data on a conventional latitude-longitude grid, we can take advantage of Xarray’s ability to apply cartopy map projections.
plt.figure(figsize=(14, 6))
ax = plt.axes(projection=ccrs.PlateCarree())
ax.set_global()
ds.Tair.plot.pcolormesh(ax=ax, transform=ccrs.PlateCarree(), x="xc", y="yc", add_colorbar=False)
ax.coastlines()
ax.set_ylim([20, 90]);
/home/runner/work/xarray-tutorial/xarray-tutorial/.pixi/envs/default/lib/python3.14/site-packages/cartopy/io/__init__.py:242: DownloadWarning: Downloading: https://naturalearth.s3.amazonaws.com/110m_physical/ne_110m_coastline.zip
  warnings.warn(f'Downloading: {url}', DownloadWarning)
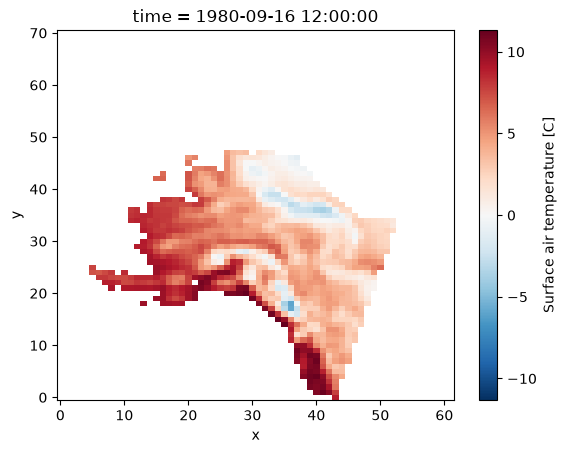
Using where with Multiple Conditions#
In Xarray’s .where() function, boolean conditions can be combined using logical operators. The bitwise and operator (&) and the bitwise or operator (|) are relevant in this case. This allows for specifying multiple masking conditions within a single .where() statement.
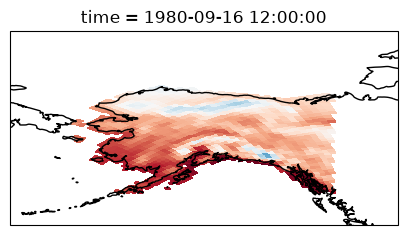
We can select data for one specific region using bound boxes. For example, here we want to access data over a region over Alaska :
# -- define a region
min_lon = 190
min_lat = 55
max_lon = 230
max_lat = 85
First we have to create our boolean masks:
mask_lon = (ds.xc >= min_lon) & (ds.xc <= max_lon)
mask_lat = (ds.yc >= min_lat) & (ds.yc <= max_lat)
Next, we can use the boolean masks for filtering data for that region:
da_masked = da.where(mask_lon & mask_lat, drop=True)

da_masked.plot();
plt.figure(figsize=(5, 5))
ax = plt.axes(projection=ccrs.PlateCarree())
ax.set_global()
da_masked.plot.pcolormesh(ax=ax, transform=ccrs.PlateCarree(), x="xc", y="yc", add_colorbar=False)
ax.coastlines()
ax.set_ylim([50, 80])
ax.set_xlim([-180, -120]);
/home/runner/work/xarray-tutorial/xarray-tutorial/.pixi/envs/default/lib/python3.14/site-packages/cartopy/io/__init__.py:242: DownloadWarning: Downloading: https://naturalearth.s3.amazonaws.com/50m_physical/ne_50m_coastline.zip
  warnings.warn(f'Downloading: {url}', DownloadWarning)
Exercise#
If we load air temperature dataset from NCEP, we could use sel method for selecting a region:
Exercise
If we load air temperature dataset from NCEP, we could use sel method for selecting a region:
ds = xr.tutorial.open_dataset("air_temperature")
ds_region = ds.sel(lat=slice(75,50), lon=slice(250,300))

ds_region.air.plot();
Can you use a similar method as above using sel to crop a region using the RASM dataset? Why?
Solution
This method will not work here as the dimensions are different from coordinates here. Specifically, the variables xc (longitude) and yc (latitude) are two-dimensional scalar fields, which differ from the logical coordinates represented by x and y.
So the code below will not give the correct answer!
Using xr.where with a Function#
We can use xr.where with a function as a condition too. For example, here we want to convert temperature to Kelvin and find if temperature is greater than 280 K:
# Define a function to use as a condition
def is_greater_than_threshold(x, threshold=300):
    # function to convert temp to K
    # and compare with threshold
    x = x + 273.15
    return x > threshold


# Apply the condition using xarray.where()
masked_data = xr.where(is_greater_than_threshold(da, 280), da, 0)

masked_data.plot()
<matplotlib.collections.QuadMesh at 0x7f9c5deea210>
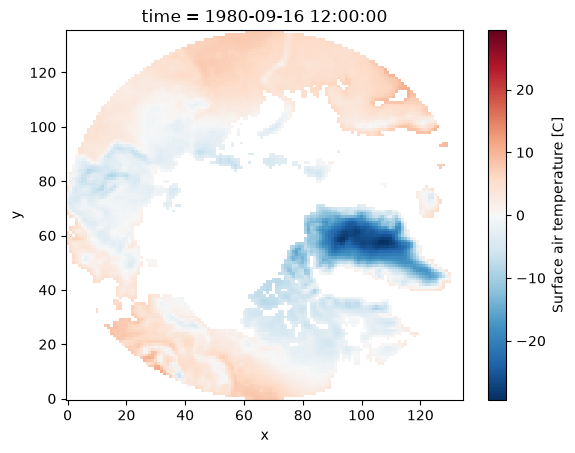
Selecting Values with isin#
To check whether elements of an xarray object contain a single object, you can compare with the equality operator == (e.g., arr == 3).
To check multiple values, we use isin():
Here is a simple example:
x_da = xr.DataArray([1, 2, 3, 4, 5], dims=["x"])

# -- select points with values equal to 2 and 4:
x_da.isin([2, 4])
<xarray.DataArray (x: 5)> Size: 5B
array([False,  True, False,  True, False])
Dimensions without coordinates: x
Tip
isin() works particularly well with where() to support indexing by arrays that are not already labels of an array.
For example, we have another DataArray that displays the status flags of the data-collecting device for our data.
Here, flags with value 0 and -1 signifies the device was functioning correctly, while 0 indicates a malfunction, implying that the resulting data collected may not be accurate.
flags = xr.DataArray(np.random.randint(-1, 5, da.shape), dims=da.dims, coords=da.coords)
flags
<xarray.DataArray (y: 205, x: 275)> Size: 451kB
array([[ 4,  2, ..., -1,  3],
       [ 2,  4, ..., -1,  3],
       ...,
       [ 0,  1, ..., -1,  1],
       [ 3,  0, ...,  4,  1]], shape=(205, 275))
Coordinates:
    xc       (y, x) float64 451kB 189.2 189.4 189.6 189.7 ... 17.4 17.15 16.91
    yc       (y, x) float64 451kB 16.53 16.78 17.02 17.27 ... 28.01 27.76 27.51
    time     object 8B 1980-09-16 12:00:00
Dimensions without coordinates: y, xNow, we want to only see the data for points where out measurement device is working correctly:
da_masked = da.where(flags.isin([1, 2, 3, 4, 5]), drop=True)
da_masked.plot();
Warning
Please note that when done repeatedly, this type of indexing is significantly slower than using sel().
Use sel instead of where as much as possible.