Computation#
Learning Objectives#
Do basic arithmetic with DataArrays and Datasets
Perform aggregation (reduction) along one or multiple dimensions of a DataArray or Dataset
Arithmetic Operations#
Arithmetic operations with a single DataArray automatically vectorize (like numpy) over all array values:
import xarray as xr
ds = xr.open_dataset("../../data/sst.mnmean.nc")
da = ds["sst"]
da
<xarray.DataArray 'sst' (time: 128, lat: 89, lon: 180)> Size: 8MB
[2050560 values with dtype=float32]
Coordinates:
  * lat      (lat) float32 356B 88.0 86.0 84.0 82.0 ... -82.0 -84.0 -86.0 -88.0
  * lon      (lon) float32 720B 0.0 2.0 4.0 6.0 8.0 ... 352.0 354.0 356.0 358.0
  * time     (time) datetime64[ns] 1kB 2010-01-01 2010-02-01 ... 2020-08-01
Attributes:
    long_name:     Monthly Means of Sea Surface Temperature
    units:         degC
    var_desc:      Sea Surface Temperature
    level_desc:    Surface
    statistic:     Mean
    dataset:       NOAA Extended Reconstructed SST V5
    parent_stat:   Individual Values
    actual_range:  [-1.8     42.32636]
valid_range: [-1.8 45. ]da + 273.15
<xarray.DataArray 'sst' (time: 128, lat: 89, lon: 180)> Size: 8MB
array([[[271.35, 271.35, 271.35, ..., 271.35, 271.35, 271.35],
        [271.35, 271.35, 271.35, ..., 271.35, 271.35, 271.35],
        [271.35, 271.35, 271.35, ..., 271.35, 271.35, 271.35],
        ...,
        [   nan,    nan,    nan, ...,    nan,    nan,    nan],
        [   nan,    nan,    nan, ...,    nan,    nan,    nan],
        [   nan,    nan,    nan, ...,    nan,    nan,    nan]],

       [[271.35, 271.35, 271.35, ..., 271.35, 271.35, 271.35],
        [271.35, 271.35, 271.35, ..., 271.35, 271.35, 271.35],
        [271.35, 271.35, 271.35, ..., 271.35, 271.35, 271.35],
        ...,
...
        [   nan,    nan,    nan, ...,    nan,    nan,    nan],
        [   nan,    nan,    nan, ...,    nan,    nan,    nan],
        [   nan,    nan,    nan, ...,    nan,    nan,    nan]],

       [[271.35, 271.35, 271.35, ..., 271.35, 271.35, 271.35],
        [271.35, 271.35, 271.35, ..., 271.35, 271.35, 271.35],
        [271.35, 271.35, 271.35, ..., 271.35, 271.35, 271.35],
        ...,
        [   nan,    nan,    nan, ...,    nan,    nan,    nan],
        [   nan,    nan,    nan, ...,    nan,    nan,    nan],
        [   nan,    nan,    nan, ...,    nan,    nan,    nan]]],
      shape=(128, 89, 180), dtype=float32)
Coordinates:
  * lat      (lat) float32 356B 88.0 86.0 84.0 82.0 ... -82.0 -84.0 -86.0 -88.0
  * lon      (lon) float32 720B 0.0 2.0 4.0 6.0 8.0 ... 352.0 354.0 356.0 358.0
* time (time) datetime64[ns] 1kB 2010-01-01 2010-02-01 ... 2020-08-01Aggregation (Reduction) Methods#
Xarray supports many of the aggregations methods that numpy has. A partial list includes: all, any, argmax, argmin, max, mean, median, min, prod, sum, std, var.
Whereas the numpy syntax would require scalar axes, xarray can use dimension names:
da_mean = da.mean(dim="time")
da_mean
<xarray.DataArray 'sst' (lat: 89, lon: 180)> Size: 64kB
array([[-1.7965803, -1.7966415, -1.7966855, ..., -1.7976017, -1.7969819,
        -1.7965505],
       [-1.7968147, -1.7963748, -1.79608  , ..., -1.7992055, -1.7980515,
        -1.7973952],
       [-1.7999116, -1.7989911, -1.7984248, ..., -1.7992449, -1.7995064,
        -1.7997831],
       ...,
       [       nan,        nan,        nan, ...,        nan,        nan,
               nan],
       [       nan,        nan,        nan, ...,        nan,        nan,
               nan],
       [       nan,        nan,        nan, ...,        nan,        nan,
               nan]], shape=(89, 180), dtype=float32)
Coordinates:
  * lat      (lat) float32 356B 88.0 86.0 84.0 82.0 ... -82.0 -84.0 -86.0 -88.0
* lon (lon) float32 720B 0.0 2.0 4.0 6.0 8.0 ... 352.0 354.0 356.0 358.0da.std(dim=["lat", "lon"]).plot()
[<matplotlib.lines.Line2D at 0x7f6fbb4fa6c0>]

Broadcasting:#
Broadcasting allows an operator or a function to act on two or more arrays to operate even if these arrays do not have the same shape. That said, not all the dimensions can be subjected to broadcasting; they must meet certain rules. The image below illustrates how performing an operation on arrays with differently coordinates will result in automatic broadcasting
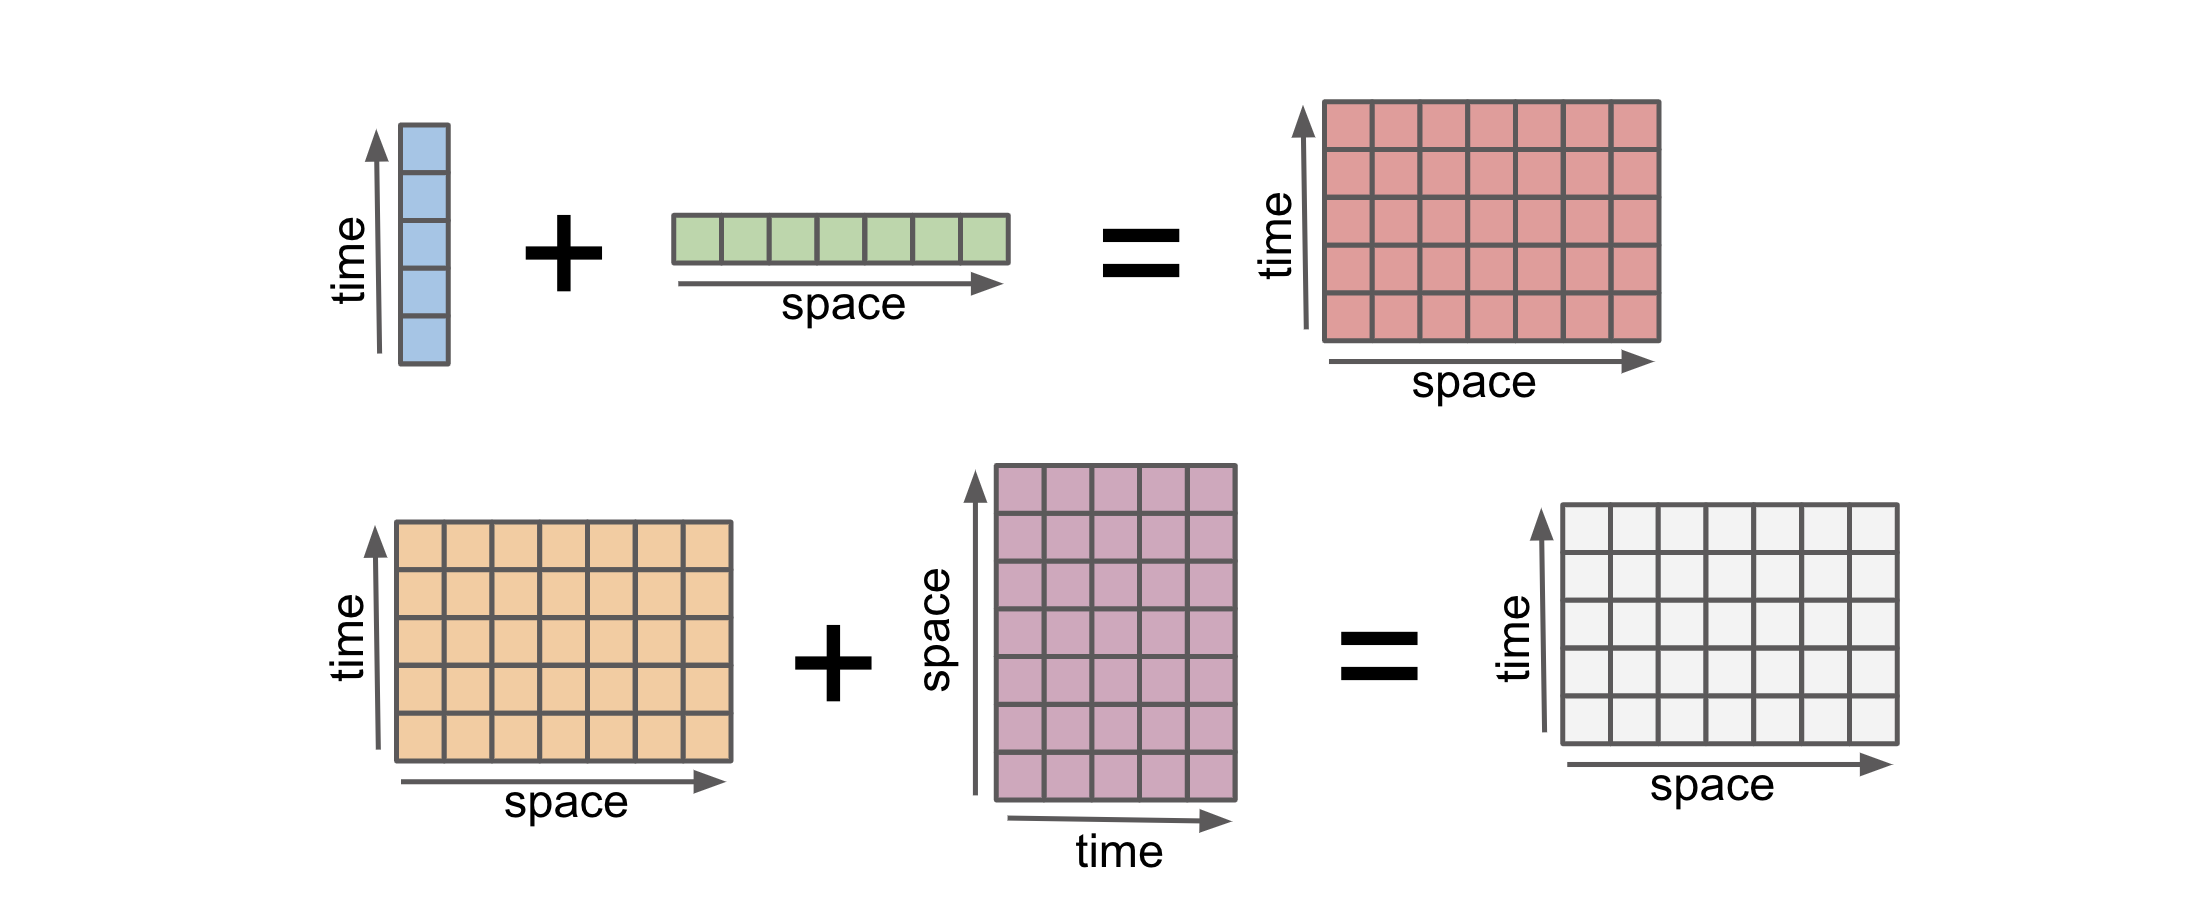
Credit: Stephan Hoyer – xarray ECMWF Python workshop
da.shape, da.dims
((128, 89, 180), ('time', 'lat', 'lon'))
da_mean.shape, da_mean.dims
((89, 180), ('lat', 'lon'))
# Subtract the mean (2D array) from the original array (3D array)
x = da - da_mean
x
<xarray.DataArray 'sst' (time: 128, lat: 89, lon: 180)> Size: 8MB
array([[[-3.4196377e-03, -3.3584833e-03, -3.3144951e-03, ...,
         -2.3982525e-03, -3.0180216e-03, -3.4494400e-03],
        [-3.1852722e-03, -3.6251545e-03, -3.9199591e-03, ...,
         -7.9441071e-04, -1.9484758e-03, -2.6047230e-03],
        [-8.8334084e-05, -1.0088682e-03, -1.5751123e-03, ...,
         -7.5507164e-04, -4.9352646e-04, -2.1684170e-04],
        ...,
        [           nan,            nan,            nan, ...,
                    nan,            nan,            nan],
        [           nan,            nan,            nan, ...,
                    nan,            nan,            nan],
        [           nan,            nan,            nan, ...,
                    nan,            nan,            nan]],

       [[-3.4196377e-03, -3.3584833e-03, -3.3144951e-03, ...,
         -2.3982525e-03, -3.0180216e-03, -3.4494400e-03],
        [-3.1852722e-03, -3.6251545e-03, -3.9199591e-03, ...,
         -7.9441071e-04, -1.9484758e-03, -2.6047230e-03],
        [-8.8334084e-05, -1.0088682e-03, -1.5751123e-03, ...,
         -7.5507164e-04, -4.9352646e-04, -2.1684170e-04],
...
                    nan,            nan,            nan],
        [           nan,            nan,            nan, ...,
                    nan,            nan,            nan],
        [           nan,            nan,            nan, ...,
                    nan,            nan,            nan]],

       [[-3.4196377e-03, -3.3584833e-03, -3.3144951e-03, ...,
         -2.3982525e-03, -3.0180216e-03, -3.4494400e-03],
        [-3.1852722e-03, -3.6251545e-03, -3.9199591e-03, ...,
         -7.9441071e-04, -1.9484758e-03, -2.6047230e-03],
        [-8.8334084e-05, -1.0088682e-03, -1.5751123e-03, ...,
         -7.5507164e-04, -4.9352646e-04, -2.1684170e-04],
        ...,
        [           nan,            nan,            nan, ...,
                    nan,            nan,            nan],
        [           nan,            nan,            nan, ...,
                    nan,            nan,            nan],
        [           nan,            nan,            nan, ...,
                    nan,            nan,            nan]]],
      shape=(128, 89, 180), dtype=float32)
Coordinates:
  * lat      (lat) float32 356B 88.0 86.0 84.0 82.0 ... -82.0 -84.0 -86.0 -88.0
  * lon      (lon) float32 720B 0.0 2.0 4.0 6.0 8.0 ... 352.0 354.0 356.0 358.0
* time (time) datetime64[ns] 1kB 2010-01-01 2010-02-01 ... 2020-08-01High level computation: groupby, resample, rolling, coarsen, weighted#
Xarray has some very useful high level objects that let you do common computations:
groupby: Bin data in to groups and reduceresample: Groupby specialized for time axes. Either downsample or upsample your data.rolling: Operate on rolling windows of your data e.g. running meancoarsen: Downsample your dataweighted: Weight your data before applying reductions
groupby#
ds
<xarray.Dataset> Size: 8MB
Dimensions:  (lat: 89, lon: 180, time: 128)
Coordinates:
  * lat      (lat) float32 356B 88.0 86.0 84.0 82.0 ... -82.0 -84.0 -86.0 -88.0
  * lon      (lon) float32 720B 0.0 2.0 4.0 6.0 8.0 ... 352.0 354.0 356.0 358.0
  * time     (time) datetime64[ns] 1kB 2010-01-01 2010-02-01 ... 2020-08-01
Data variables:
    sst      (time, lat, lon) float32 8MB -1.8 -1.8 -1.8 -1.8 ... nan nan nan
Attributes: (12/37)
    climatology:               Climatology is based on 1971-2000 SST, Xue, Y....
    description:               In situ data: ICOADS2.5 before 2007 and NCEP i...
    keywords_vocabulary:       NASA Global Change Master Directory (GCMD) Sci...
    keywords:                  Earth Science > Oceans > Ocean Temperature > S...
    instrument:                Conventional thermometers
    source_comment:            SSTs were observed by conventional thermometer...
    ...                        ...
    creator_url_original:      https://www.ncei.noaa.gov
    license:                   No constraints on data access or use
    comment:                   SSTs were observed by conventional thermometer...
    summary:                   ERSST.v5 is developed based on v4 after revisi...
    dataset_title:             NOAA Extended Reconstructed SST V5
data_modified: 2020-09-07# seasonal groups
ds.groupby("time.season")
<DatasetGroupBy, grouped over 1 grouper(s), 4 groups in total:
    'season': UniqueGrouper('season'), 4/4 groups with labels 'DJF', 'JJA', 'MAM', 'SON'>
# day of the week groups
ds.groupby("time.dayofweek")
<DatasetGroupBy, grouped over 1 grouper(s), 7 groups in total:
    'dayofweek': UniqueGrouper('dayofweek'), 7/7 groups with labels 0, 1, 2, 3, 4, 5, 6>
# compute a seasonal mean
seasonal_mean = ds.groupby("time.season").mean()
seasonal_mean
<xarray.Dataset> Size: 257kB
Dimensions:  (season: 4, lat: 89, lon: 180)
Coordinates:
  * lat      (lat) float32 356B 88.0 86.0 84.0 82.0 ... -82.0 -84.0 -86.0 -88.0
  * lon      (lon) float32 720B 0.0 2.0 4.0 6.0 8.0 ... 352.0 354.0 356.0 358.0
  * season   (season) object 32B 'DJF' 'JJA' 'MAM' 'SON'
Data variables:
    sst      (season, lat, lon) float32 256kB -1.799 -1.799 -1.8 ... nan nan nan
Attributes: (12/37)
    climatology:               Climatology is based on 1971-2000 SST, Xue, Y....
    description:               In situ data: ICOADS2.5 before 2007 and NCEP i...
    keywords_vocabulary:       NASA Global Change Master Directory (GCMD) Sci...
    keywords:                  Earth Science > Oceans > Ocean Temperature > S...
    instrument:                Conventional thermometers
    source_comment:            SSTs were observed by conventional thermometer...
    ...                        ...
    creator_url_original:      https://www.ncei.noaa.gov
    license:                   No constraints on data access or use
    comment:                   SSTs were observed by conventional thermometer...
    summary:                   ERSST.v5 is developed based on v4 after revisi...
    dataset_title:             NOAA Extended Reconstructed SST V5
data_modified: 2020-09-07# The seasons are out of order (they are alphabetically sorted). This is a common annoyance. The solution is to use .reindex
seasonal_mean = seasonal_mean.reindex(season=["DJF", "MAM", "JJA", "SON"])
seasonal_mean
<xarray.Dataset> Size: 257kB
Dimensions:  (lat: 89, lon: 180, season: 4)
Coordinates:
  * lat      (lat) float32 356B 88.0 86.0 84.0 82.0 ... -82.0 -84.0 -86.0 -88.0
  * lon      (lon) float32 720B 0.0 2.0 4.0 6.0 8.0 ... 352.0 354.0 356.0 358.0
  * season   (season) <U3 48B 'DJF' 'MAM' 'JJA' 'SON'
Data variables:
    sst      (season, lat, lon) float32 256kB -1.799 -1.799 -1.8 ... nan nan nan
Attributes: (12/37)
    climatology:               Climatology is based on 1971-2000 SST, Xue, Y....
    description:               In situ data: ICOADS2.5 before 2007 and NCEP i...
    keywords_vocabulary:       NASA Global Change Master Directory (GCMD) Sci...
    keywords:                  Earth Science > Oceans > Ocean Temperature > S...
    instrument:                Conventional thermometers
    source_comment:            SSTs were observed by conventional thermometer...
    ...                        ...
    creator_url_original:      https://www.ncei.noaa.gov
    license:                   No constraints on data access or use
    comment:                   SSTs were observed by conventional thermometer...
    summary:                   ERSST.v5 is developed based on v4 after revisi...
    dataset_title:             NOAA Extended Reconstructed SST V5
data_modified: 2020-09-07seasonal_mean.sst.plot(col="season", robust=True, cmap="turbo")
<xarray.plot.facetgrid.FacetGrid at 0x7f6fbb008770>

resample#
# resample to bi-monthly frequency
ds.sst.resample(time="2MS").mean()
<xarray.DataArray 'sst' (time: 64, lat: 89, lon: 180)> Size: 4MB
array([[[-1.8, -1.8, -1.8, ..., -1.8, -1.8, -1.8],
        [-1.8, -1.8, -1.8, ..., -1.8, -1.8, -1.8],
        [-1.8, -1.8, -1.8, ..., -1.8, -1.8, -1.8],
        ...,
        [ nan,  nan,  nan, ...,  nan,  nan,  nan],
        [ nan,  nan,  nan, ...,  nan,  nan,  nan],
        [ nan,  nan,  nan, ...,  nan,  nan,  nan]],

       [[-1.8, -1.8, -1.8, ..., -1.8, -1.8, -1.8],
        [-1.8, -1.8, -1.8, ..., -1.8, -1.8, -1.8],
        [-1.8, -1.8, -1.8, ..., -1.8, -1.8, -1.8],
        ...,
...
        [ nan,  nan,  nan, ...,  nan,  nan,  nan],
        [ nan,  nan,  nan, ...,  nan,  nan,  nan],
        [ nan,  nan,  nan, ...,  nan,  nan,  nan]],

       [[-1.8, -1.8, -1.8, ..., -1.8, -1.8, -1.8],
        [-1.8, -1.8, -1.8, ..., -1.8, -1.8, -1.8],
        [-1.8, -1.8, -1.8, ..., -1.8, -1.8, -1.8],
        ...,
        [ nan,  nan,  nan, ...,  nan,  nan,  nan],
        [ nan,  nan,  nan, ...,  nan,  nan,  nan],
        [ nan,  nan,  nan, ...,  nan,  nan,  nan]]],
      shape=(64, 89, 180), dtype=float32)
Coordinates:
  * lat      (lat) float32 356B 88.0 86.0 84.0 82.0 ... -82.0 -84.0 -86.0 -88.0
  * lon      (lon) float32 720B 0.0 2.0 4.0 6.0 8.0 ... 352.0 354.0 356.0 358.0
  * time     (time) datetime64[ns] 512B 2010-01-01 2010-03-01 ... 2020-07-01
Attributes:
    long_name:     Monthly Means of Sea Surface Temperature
    units:         degC
    var_desc:      Sea Surface Temperature
    level_desc:    Surface
    statistic:     Mean
    dataset:       NOAA Extended Reconstructed SST V5
    parent_stat:   Individual Values
    actual_range:  [-1.8     42.32636]
valid_range: [-1.8 45. ]rolling window operations#
# A rolling mean with a window size of 7
ds.sst.rolling(time=7).mean()
<xarray.DataArray 'sst' (time: 128, lat: 89, lon: 180)> Size: 8MB
array([[[ nan,  nan,  nan, ...,  nan,  nan,  nan],
        [ nan,  nan,  nan, ...,  nan,  nan,  nan],
        [ nan,  nan,  nan, ...,  nan,  nan,  nan],
        ...,
        [ nan,  nan,  nan, ...,  nan,  nan,  nan],
        [ nan,  nan,  nan, ...,  nan,  nan,  nan],
        [ nan,  nan,  nan, ...,  nan,  nan,  nan]],

       [[ nan,  nan,  nan, ...,  nan,  nan,  nan],
        [ nan,  nan,  nan, ...,  nan,  nan,  nan],
        [ nan,  nan,  nan, ...,  nan,  nan,  nan],
        ...,
...
        [ nan,  nan,  nan, ...,  nan,  nan,  nan],
        [ nan,  nan,  nan, ...,  nan,  nan,  nan],
        [ nan,  nan,  nan, ...,  nan,  nan,  nan]],

       [[-1.8, -1.8, -1.8, ..., -1.8, -1.8, -1.8],
        [-1.8, -1.8, -1.8, ..., -1.8, -1.8, -1.8],
        [-1.8, -1.8, -1.8, ..., -1.8, -1.8, -1.8],
        ...,
        [ nan,  nan,  nan, ...,  nan,  nan,  nan],
        [ nan,  nan,  nan, ...,  nan,  nan,  nan],
        [ nan,  nan,  nan, ...,  nan,  nan,  nan]],

       [[-1.8, -1.8, -1.8, ..., -1.8, -1.8, -1.8],
        [-1.8, -1.8, -1.8, ..., -1.8, -1.8, -1.8],
        [-1.8, -1.8, -1.8, ..., -1.8, -1.8, -1.8],
        ...,
        [ nan,  nan,  nan, ...,  nan,  nan,  nan],
        [ nan,  nan,  nan, ...,  nan,  nan,  nan],
        [ nan,  nan,  nan, ...,  nan,  nan,  nan]]],
      shape=(128, 89, 180), dtype=float32)
Coordinates:
  * lat      (lat) float32 356B 88.0 86.0 84.0 82.0 ... -82.0 -84.0 -86.0 -88.0
  * lon      (lon) float32 720B 0.0 2.0 4.0 6.0 8.0 ... 352.0 354.0 356.0 358.0
  * time     (time) datetime64[ns] 1kB 2010-01-01 2010-02-01 ... 2020-08-01
Attributes:
    long_name:     Monthly Means of Sea Surface Temperature
    units:         degC
    var_desc:      Sea Surface Temperature
    level_desc:    Surface
    statistic:     Mean
    dataset:       NOAA Extended Reconstructed SST V5
    parent_stat:   Individual Values
    actual_range:  [-1.8     42.32636]
valid_range: [-1.8 45. ]Going Further#
Computation with xarray (extended version): Computation with xarray notebook
Plotting and visualization (extended version): Plotting and Visualization notebook