Indexing and Selecting Data#
Learning Objectives#
Select data by position using
.iselwith values or slicesSelect data by label using
.selwith values or slicesSelect timeseries data by date/time with values or slices
Use nearest-neighbor lookups with
.sel
Why do we need label-based indexing?#
Scientific data is inherently labeled. For example, time series data includes timestamps that label individual periods or points in time, spatial data has coordinates (e.g. longitude, latitude, elevation), and model or laboratory experiments are often identified by unique identifiers.
import xarray as xr

%config InlineBackend.figure_format='retina'
ds = xr.open_dataset("../../data/sst.mnmean.nc")
ds
<xarray.Dataset> Size: 8MB
Dimensions:  (lat: 89, lon: 180, time: 128)
Coordinates:
  * lat      (lat) float32 356B 88.0 86.0 84.0 82.0 ... -82.0 -84.0 -86.0 -88.0
  * lon      (lon) float32 720B 0.0 2.0 4.0 6.0 8.0 ... 352.0 354.0 356.0 358.0
  * time     (time) datetime64[ns] 1kB 2010-01-01 2010-02-01 ... 2020-08-01
Data variables:
    sst      (time, lat, lon) float32 8MB ...
Attributes: (12/37)
    climatology:               Climatology is based on 1971-2000 SST, Xue, Y....
    description:               In situ data: ICOADS2.5 before 2007 and NCEP i...
    keywords_vocabulary:       NASA Global Change Master Directory (GCMD) Sci...
    keywords:                  Earth Science > Oceans > Ocean Temperature > S...
    instrument:                Conventional thermometers
    source_comment:            SSTs were observed by conventional thermometer...
    ...                        ...
    creator_url_original:      https://www.ncei.noaa.gov
    license:                   No constraints on data access or use
    comment:                   SSTs were observed by conventional thermometer...
    summary:                   ERSST.v5 is developed based on v4 after revisi...
    dataset_title:             NOAA Extended Reconstructed SST V5
data_modified: 2020-09-07- lat: 89
- lon: 180
- time: 128
- lat(lat)float3288.0 86.0 84.0 ... -86.0 -88.0
- units :
- degrees_north
- long_name :
- Latitude
- actual_range :
- [ 88. -88.]
- standard_name :
- latitude
- axis :
- Y
- coordinate_defines :
- center
array([ 88., 86., 84., 82., 80., 78., 76., 74., 72., 70., 68., 66., 64., 62., 60., 58., 56., 54., 52., 50., 48., 46., 44., 42., 40., 38., 36., 34., 32., 30., 28., 26., 24., 22., 20., 18., 16., 14., 12., 10., 8., 6., 4., 2., 0., -2., -4., -6., -8., -10., -12., -14., -16., -18., -20., -22., -24., -26., -28., -30., -32., -34., -36., -38., -40., -42., -44., -46., -48., -50., -52., -54., -56., -58., -60., -62., -64., -66., -68., -70., -72., -74., -76., -78., -80., -82., -84., -86., -88.], dtype=float32) - lon(lon)float320.0 2.0 4.0 ... 354.0 356.0 358.0
- units :
- degrees_east
- long_name :
- Longitude
- actual_range :
- [ 0. 358.]
- standard_name :
- longitude
- axis :
- X
- coordinate_defines :
- center
array([ 0., 2., 4., 6., 8., 10., 12., 14., 16., 18., 20., 22., 24., 26., 28., 30., 32., 34., 36., 38., 40., 42., 44., 46., 48., 50., 52., 54., 56., 58., 60., 62., 64., 66., 68., 70., 72., 74., 76., 78., 80., 82., 84., 86., 88., 90., 92., 94., 96., 98., 100., 102., 104., 106., 108., 110., 112., 114., 116., 118., 120., 122., 124., 126., 128., 130., 132., 134., 136., 138., 140., 142., 144., 146., 148., 150., 152., 154., 156., 158., 160., 162., 164., 166., 168., 170., 172., 174., 176., 178., 180., 182., 184., 186., 188., 190., 192., 194., 196., 198., 200., 202., 204., 206., 208., 210., 212., 214., 216., 218., 220., 222., 224., 226., 228., 230., 232., 234., 236., 238., 240., 242., 244., 246., 248., 250., 252., 254., 256., 258., 260., 262., 264., 266., 268., 270., 272., 274., 276., 278., 280., 282., 284., 286., 288., 290., 292., 294., 296., 298., 300., 302., 304., 306., 308., 310., 312., 314., 316., 318., 320., 322., 324., 326., 328., 330., 332., 334., 336., 338., 340., 342., 344., 346., 348., 350., 352., 354., 356., 358.], dtype=float32) - time(time)datetime64[ns]2010-01-01 ... 2020-08-01
- long_name :
- Time
- delta_t :
- 0000-01-00 00:00:00
- avg_period :
- 0000-01-00 00:00:00
- prev_avg_period :
- 0000-00-07 00:00:00
- standard_name :
- time
- axis :
- T
- actual_range :
- [19723. 80566.]
array(['2010-01-01T00:00:00.000000000', '2010-02-01T00:00:00.000000000',
       '2010-03-01T00:00:00.000000000', '2010-04-01T00:00:00.000000000',
       '2010-05-01T00:00:00.000000000', '2010-06-01T00:00:00.000000000',
       '2010-07-01T00:00:00.000000000', '2010-08-01T00:00:00.000000000',
       '2010-09-01T00:00:00.000000000', '2010-10-01T00:00:00.000000000',
       '2010-11-01T00:00:00.000000000', '2010-12-01T00:00:00.000000000',
       '2011-01-01T00:00:00.000000000', '2011-02-01T00:00:00.000000000',
       '2011-03-01T00:00:00.000000000', '2011-04-01T00:00:00.000000000',
       '2011-05-01T00:00:00.000000000', '2011-06-01T00:00:00.000000000',
       '2011-07-01T00:00:00.000000000', '2011-08-01T00:00:00.000000000',
       '2011-09-01T00:00:00.000000000', '2011-10-01T00:00:00.000000000',
       '2011-11-01T00:00:00.000000000', '2011-12-01T00:00:00.000000000',
       '2012-01-01T00:00:00.000000000', '2012-02-01T00:00:00.000000000',
       '2012-03-01T00:00:00.000000000', '2012-04-01T00:00:00.000000000',
       '2012-05-01T00:00:00.000000000', '2012-06-01T00:00:00.000000000',
       '2012-07-01T00:00:00.000000000', '2012-08-01T00:00:00.000000000',
       '2012-09-01T00:00:00.000000000', '2012-10-01T00:00:00.000000000',
       '2012-11-01T00:00:00.000000000', '2012-12-01T00:00:00.000000000',
       '2013-01-01T00:00:00.000000000', '2013-02-01T00:00:00.000000000',
       '2013-03-01T00:00:00.000000000', '2013-04-01T00:00:00.000000000',
       '2013-05-01T00:00:00.000000000', '2013-06-01T00:00:00.000000000',
       '2013-07-01T00:00:00.000000000', '2013-08-01T00:00:00.000000000',
       '2013-09-01T00:00:00.000000000', '2013-10-01T00:00:00.000000000',
       '2013-11-01T00:00:00.000000000', '2013-12-01T00:00:00.000000000',
       '2014-01-01T00:00:00.000000000', '2014-02-01T00:00:00.000000000',
       '2014-03-01T00:00:00.000000000', '2014-04-01T00:00:00.000000000',
       '2014-05-01T00:00:00.000000000', '2014-06-01T00:00:00.000000000',
       '2014-07-01T00:00:00.000000000', '2014-08-01T00:00:00.000000000',
       '2014-09-01T00:00:00.000000000', '2014-10-01T00:00:00.000000000',
       '2014-11-01T00:00:00.000000000', '2014-12-01T00:00:00.000000000',
       '2015-01-01T00:00:00.000000000', '2015-02-01T00:00:00.000000000',
       '2015-03-01T00:00:00.000000000', '2015-04-01T00:00:00.000000000',
       '2015-05-01T00:00:00.000000000', '2015-06-01T00:00:00.000000000',
       '2015-07-01T00:00:00.000000000', '2015-08-01T00:00:00.000000000',
       '2015-09-01T00:00:00.000000000', '2015-10-01T00:00:00.000000000',
       '2015-11-01T00:00:00.000000000', '2015-12-01T00:00:00.000000000',
       '2016-01-01T00:00:00.000000000', '2016-02-01T00:00:00.000000000',
       '2016-03-01T00:00:00.000000000', '2016-04-01T00:00:00.000000000',
       '2016-05-01T00:00:00.000000000', '2016-06-01T00:00:00.000000000',
       '2016-07-01T00:00:00.000000000', '2016-08-01T00:00:00.000000000',
       '2016-09-01T00:00:00.000000000', '2016-10-01T00:00:00.000000000',
       '2016-11-01T00:00:00.000000000', '2016-12-01T00:00:00.000000000',
       '2017-01-01T00:00:00.000000000', '2017-02-01T00:00:00.000000000',
       '2017-03-01T00:00:00.000000000', '2017-04-01T00:00:00.000000000',
       '2017-05-01T00:00:00.000000000', '2017-06-01T00:00:00.000000000',
       '2017-07-01T00:00:00.000000000', '2017-08-01T00:00:00.000000000',
       '2017-09-01T00:00:00.000000000', '2017-10-01T00:00:00.000000000',
       '2017-11-01T00:00:00.000000000', '2017-12-01T00:00:00.000000000',
       '2018-01-01T00:00:00.000000000', '2018-02-01T00:00:00.000000000',
       '2018-03-01T00:00:00.000000000', '2018-04-01T00:00:00.000000000',
       '2018-05-01T00:00:00.000000000', '2018-06-01T00:00:00.000000000',
       '2018-07-01T00:00:00.000000000', '2018-08-01T00:00:00.000000000',
       '2018-09-01T00:00:00.000000000', '2018-10-01T00:00:00.000000000',
       '2018-11-01T00:00:00.000000000', '2018-12-01T00:00:00.000000000',
       '2019-01-01T00:00:00.000000000', '2019-02-01T00:00:00.000000000',
       '2019-03-01T00:00:00.000000000', '2019-04-01T00:00:00.000000000',
       '2019-05-01T00:00:00.000000000', '2019-06-01T00:00:00.000000000',
       '2019-07-01T00:00:00.000000000', '2019-08-01T00:00:00.000000000',
       '2019-09-01T00:00:00.000000000', '2019-10-01T00:00:00.000000000',
       '2019-11-01T00:00:00.000000000', '2019-12-01T00:00:00.000000000',
       '2020-01-01T00:00:00.000000000', '2020-02-01T00:00:00.000000000',
       '2020-03-01T00:00:00.000000000', '2020-04-01T00:00:00.000000000',
       '2020-05-01T00:00:00.000000000', '2020-06-01T00:00:00.000000000',
       '2020-07-01T00:00:00.000000000', '2020-08-01T00:00:00.000000000'],
      dtype='datetime64[ns]')
- sst(time, lat, lon)float32...
- long_name :
- Monthly Means of Sea Surface Temperature
- units :
- degC
- var_desc :
- Sea Surface Temperature
- level_desc :
- Surface
- statistic :
- Mean
- dataset :
- NOAA Extended Reconstructed SST V5
- parent_stat :
- Individual Values
- actual_range :
- [-1.8 42.32636]
- valid_range :
- [-1.8 45. ]
[2050560 values with dtype=float32]
- latPandasIndex
PandasIndex(Index([ 88.0, 86.0, 84.0, 82.0, 80.0, 78.0, 76.0, 74.0, 72.0, 70.0, 68.0, 66.0, 64.0, 62.0, 60.0, 58.0, 56.0, 54.0, 52.0, 50.0, 48.0, 46.0, 44.0, 42.0, 40.0, 38.0, 36.0, 34.0, 32.0, 30.0, 28.0, 26.0, 24.0, 22.0, 20.0, 18.0, 16.0, 14.0, 12.0, 10.0, 8.0, 6.0, 4.0, 2.0, 0.0, -2.0, -4.0, -6.0, -8.0, -10.0, -12.0, -14.0, -16.0, -18.0, -20.0, -22.0, -24.0, -26.0, -28.0, -30.0, -32.0, -34.0, -36.0, -38.0, -40.0, -42.0, -44.0, -46.0, -48.0, -50.0, -52.0, -54.0, -56.0, -58.0, -60.0, -62.0, -64.0, -66.0, -68.0, -70.0, -72.0, -74.0, -76.0, -78.0, -80.0, -82.0, -84.0, -86.0, -88.0], dtype='float32', name='lat')) - lonPandasIndex
PandasIndex(Index([ 0.0, 2.0, 4.0, 6.0, 8.0, 10.0, 12.0, 14.0, 16.0, 18.0, ... 340.0, 342.0, 344.0, 346.0, 348.0, 350.0, 352.0, 354.0, 356.0, 358.0], dtype='float32', name='lon', length=180)) - timePandasIndex
PandasIndex(DatetimeIndex(['2010-01-01', '2010-02-01', '2010-03-01', '2010-04-01',
               '2010-05-01', '2010-06-01', '2010-07-01', '2010-08-01',
               '2010-09-01', '2010-10-01',
               ...
               '2019-11-01', '2019-12-01', '2020-01-01', '2020-02-01',
               '2020-03-01', '2020-04-01', '2020-05-01', '2020-06-01',
               '2020-07-01', '2020-08-01'],
              dtype='datetime64[ns]', name='time', length=128, freq=None))
- climatology :
- Climatology is based on 1971-2000 SST, Xue, Y., T. M. Smith, and R. W. Reynolds, 2003: Interdecadal changes of 30-yr SST normals during 1871.2000. Journal of Climate, 16, 1601-1612.
- description :
- In situ data: ICOADS2.5 before 2007 and NCEP in situ data from 2008 to present. Ice data: HadISST ice before 2010 and NCEP ice after 2010.
- keywords_vocabulary :
- NASA Global Change Master Directory (GCMD) Science Keywords
- keywords :
- Earth Science > Oceans > Ocean Temperature > Sea Surface Temperature >
- instrument :
- Conventional thermometers
- source_comment :
- SSTs were observed by conventional thermometers in Buckets (insulated or un-insulated canvas and wooded buckets) or Engine Room Intaker
- geospatial_lon_min :
- -1.0
- geospatial_lon_max :
- 359.0
- geospatial_laty_max :
- 89.0
- geospatial_laty_min :
- -89.0
- geospatial_lat_max :
- 89.0
- geospatial_lat_min :
- -89.0
- geospatial_lat_units :
- degrees_north
- geospatial_lon_units :
- degrees_east
- cdm_data_type :
- Grid
- project :
- NOAA Extended Reconstructed Sea Surface Temperature (ERSST)
- original_publisher_url :
- http://www.ncdc.noaa.gov
- References :
- https://www.ncdc.noaa.gov/data-access/marineocean-data/extended-reconstructed-sea-surface-temperature-ersst-v5 at NCEI and http://www.esrl.noaa.gov/psd/data/gridded/data.noaa.ersst.v5.html
- source :
- In situ data: ICOADS R3.0 before 2015, NCEP in situ GTS from 2016 to present, and Argo SST from 1999 to present. Ice data: HadISST2 ice before 2015, and NCEP ice after 2015
- title :
- NOAA ERSSTv5 (in situ only)
- history :
- created 07/2017 by PSD data using NCEI's ERSST V5 NetCDF values
- institution :
- This version written at NOAA/ESRL PSD: obtained from NOAA/NESDIS/National Centers for Environmental Information and time aggregated. Original Full Source: NOAA/NESDIS/NCEI/CCOG
- citation :
- Huang et al, 2017: Extended Reconstructed Sea Surface Temperatures Version 5 (ERSSTv5): Upgrades, Validations, and Intercomparisons. Journal of Climate, https://doi.org/10.1175/JCLI-D-16-0836.1
- platform :
- Ship and Buoy SSTs from ICOADS R3.0 and NCEP GTS
- standard_name_vocabulary :
- CF Standard Name Table (v40, 25 January 2017)
- processing_level :
- NOAA Level 4
- Conventions :
- CF-1.6, ACDD-1.3
- metadata_link :
- :metadata_link = https://doi.org/10.7289/V5T72FNM (original format)
- creator_name :
- Boyin Huang (original)
- date_created :
- 2017-06-30T12:18:00Z (original)
- product_version :
- Version 5
- creator_url_original :
- https://www.ncei.noaa.gov
- license :
- No constraints on data access or use
- comment :
- SSTs were observed by conventional thermometers in Buckets (insulated or un-insulated canvas and wooded buckets), Engine Room Intakers, or floats and drifters
- summary :
- ERSST.v5 is developed based on v4 after revisions of 8 parameters using updated data sets and advanced knowledge of ERSST analysis
- dataset_title :
- NOAA Extended Reconstructed SST V5
- data_modified :
- 2020-09-07
NumPy Positional Indexing#
When working with numpy, indexing is done by position (slices/ranges/scalars).
t = ds["sst"].data  # numpy array
t
Show code cell output
Hide code cell output
array([[[-1.8, -1.8, -1.8, ..., -1.8, -1.8, -1.8],
        [-1.8, -1.8, -1.8, ..., -1.8, -1.8, -1.8],
        [-1.8, -1.8, -1.8, ..., -1.8, -1.8, -1.8],
        ...,
        [ nan,  nan,  nan, ...,  nan,  nan,  nan],
        [ nan,  nan,  nan, ...,  nan,  nan,  nan],
        [ nan,  nan,  nan, ...,  nan,  nan,  nan]],

       [[-1.8, -1.8, -1.8, ..., -1.8, -1.8, -1.8],
        [-1.8, -1.8, -1.8, ..., -1.8, -1.8, -1.8],
        [-1.8, -1.8, -1.8, ..., -1.8, -1.8, -1.8],
        ...,
        [ nan,  nan,  nan, ...,  nan,  nan,  nan],
        [ nan,  nan,  nan, ...,  nan,  nan,  nan],
        [ nan,  nan,  nan, ...,  nan,  nan,  nan]],

       ...,

       [[-1.8, -1.8, -1.8, ..., -1.8, -1.8, -1.8],
        [-1.8, -1.8, -1.8, ..., -1.8, -1.8, -1.8],
        [-1.8, -1.8, -1.8, ..., -1.8, -1.8, -1.8],
        ...,
        [ nan,  nan,  nan, ...,  nan,  nan,  nan],
        [ nan,  nan,  nan, ...,  nan,  nan,  nan],
        [ nan,  nan,  nan, ...,  nan,  nan,  nan]],

       [[-1.8, -1.8, -1.8, ..., -1.8, -1.8, -1.8],
        [-1.8, -1.8, -1.8, ..., -1.8, -1.8, -1.8],
        [-1.8, -1.8, -1.8, ..., -1.8, -1.8, -1.8],
        ...,
        [ nan,  nan,  nan, ...,  nan,  nan,  nan],
        [ nan,  nan,  nan, ...,  nan,  nan,  nan],
        [ nan,  nan,  nan, ...,  nan,  nan,  nan]]],
      shape=(128, 89, 180), dtype=float32)
t.shape
(128, 89, 180)
# extract a time-series for one spatial location
t[:, 20, 40]
Show code cell output
Hide code cell output
array([nan, nan, nan, nan, nan, nan, nan, nan, nan, nan, nan, nan, nan,
       nan, nan, nan, nan, nan, nan, nan, nan, nan, nan, nan, nan, nan,
       nan, nan, nan, nan, nan, nan, nan, nan, nan, nan, nan, nan, nan,
       nan, nan, nan, nan, nan, nan, nan, nan, nan, nan, nan, nan, nan,
       nan, nan, nan, nan, nan, nan, nan, nan, nan, nan, nan, nan, nan,
       nan, nan, nan, nan, nan, nan, nan, nan, nan, nan, nan, nan, nan,
       nan, nan, nan, nan, nan, nan, nan, nan, nan, nan, nan, nan, nan,
       nan, nan, nan, nan, nan, nan, nan, nan, nan, nan, nan, nan, nan,
       nan, nan, nan, nan, nan, nan, nan, nan, nan, nan, nan, nan, nan,
       nan, nan, nan, nan, nan, nan, nan, nan, nan, nan, nan],
      dtype=float32)
Indexing with xarray#
xarray offers extremely flexible indexing routines that combine the best features of NumPy and pandas for data selection.
da = ds["sst"]  # Extract data array
da
Show code cell output
Hide code cell output
<xarray.DataArray 'sst' (time: 128, lat: 89, lon: 180)> Size: 8MB
array([[[-1.8, -1.8, ..., -1.8, -1.8],
        [-1.8, -1.8, ..., -1.8, -1.8],
        ...,
        [ nan,  nan, ...,  nan,  nan],
        [ nan,  nan, ...,  nan,  nan]],

       [[-1.8, -1.8, ..., -1.8, -1.8],
        [-1.8, -1.8, ..., -1.8, -1.8],
        ...,
        [ nan,  nan, ...,  nan,  nan],
        [ nan,  nan, ...,  nan,  nan]],

       ...,

       [[-1.8, -1.8, ..., -1.8, -1.8],
        [-1.8, -1.8, ..., -1.8, -1.8],
        ...,
        [ nan,  nan, ...,  nan,  nan],
        [ nan,  nan, ...,  nan,  nan]],

       [[-1.8, -1.8, ..., -1.8, -1.8],
        [-1.8, -1.8, ..., -1.8, -1.8],
        ...,
        [ nan,  nan, ...,  nan,  nan],
        [ nan,  nan, ...,  nan,  nan]]], shape=(128, 89, 180), dtype=float32)
Coordinates:
  * lat      (lat) float32 356B 88.0 86.0 84.0 82.0 ... -82.0 -84.0 -86.0 -88.0
  * lon      (lon) float32 720B 0.0 2.0 4.0 6.0 8.0 ... 352.0 354.0 356.0 358.0
  * time     (time) datetime64[ns] 1kB 2010-01-01 2010-02-01 ... 2020-08-01
Attributes:
    long_name:     Monthly Means of Sea Surface Temperature
    units:         degC
    var_desc:      Sea Surface Temperature
    level_desc:    Surface
    statistic:     Mean
    dataset:       NOAA Extended Reconstructed SST V5
    parent_stat:   Individual Values
    actual_range:  [-1.8     42.32636]
valid_range: [-1.8 45. ]- time: 128
- lat: 89
- lon: 180
- -1.8 -1.8 -1.8 -1.8 -1.8 -1.8 -1.8 ... nan nan nan nan nan nan nan
array([[[-1.8, -1.8, ..., -1.8, -1.8], [-1.8, -1.8, ..., -1.8, -1.8], ..., [ nan, nan, ..., nan, nan], [ nan, nan, ..., nan, nan]], [[-1.8, -1.8, ..., -1.8, -1.8], [-1.8, -1.8, ..., -1.8, -1.8], ..., [ nan, nan, ..., nan, nan], [ nan, nan, ..., nan, nan]], ..., [[-1.8, -1.8, ..., -1.8, -1.8], [-1.8, -1.8, ..., -1.8, -1.8], ..., [ nan, nan, ..., nan, nan], [ nan, nan, ..., nan, nan]], [[-1.8, -1.8, ..., -1.8, -1.8], [-1.8, -1.8, ..., -1.8, -1.8], ..., [ nan, nan, ..., nan, nan], [ nan, nan, ..., nan, nan]]], shape=(128, 89, 180), dtype=float32) - lat(lat)float3288.0 86.0 84.0 ... -86.0 -88.0
- units :
- degrees_north
- long_name :
- Latitude
- actual_range :
- [ 88. -88.]
- standard_name :
- latitude
- axis :
- Y
- coordinate_defines :
- center
array([ 88., 86., 84., 82., 80., 78., 76., 74., 72., 70., 68., 66., 64., 62., 60., 58., 56., 54., 52., 50., 48., 46., 44., 42., 40., 38., 36., 34., 32., 30., 28., 26., 24., 22., 20., 18., 16., 14., 12., 10., 8., 6., 4., 2., 0., -2., -4., -6., -8., -10., -12., -14., -16., -18., -20., -22., -24., -26., -28., -30., -32., -34., -36., -38., -40., -42., -44., -46., -48., -50., -52., -54., -56., -58., -60., -62., -64., -66., -68., -70., -72., -74., -76., -78., -80., -82., -84., -86., -88.], dtype=float32) - lon(lon)float320.0 2.0 4.0 ... 354.0 356.0 358.0
- units :
- degrees_east
- long_name :
- Longitude
- actual_range :
- [ 0. 358.]
- standard_name :
- longitude
- axis :
- X
- coordinate_defines :
- center
array([ 0., 2., 4., 6., 8., 10., 12., 14., 16., 18., 20., 22., 24., 26., 28., 30., 32., 34., 36., 38., 40., 42., 44., 46., 48., 50., 52., 54., 56., 58., 60., 62., 64., 66., 68., 70., 72., 74., 76., 78., 80., 82., 84., 86., 88., 90., 92., 94., 96., 98., 100., 102., 104., 106., 108., 110., 112., 114., 116., 118., 120., 122., 124., 126., 128., 130., 132., 134., 136., 138., 140., 142., 144., 146., 148., 150., 152., 154., 156., 158., 160., 162., 164., 166., 168., 170., 172., 174., 176., 178., 180., 182., 184., 186., 188., 190., 192., 194., 196., 198., 200., 202., 204., 206., 208., 210., 212., 214., 216., 218., 220., 222., 224., 226., 228., 230., 232., 234., 236., 238., 240., 242., 244., 246., 248., 250., 252., 254., 256., 258., 260., 262., 264., 266., 268., 270., 272., 274., 276., 278., 280., 282., 284., 286., 288., 290., 292., 294., 296., 298., 300., 302., 304., 306., 308., 310., 312., 314., 316., 318., 320., 322., 324., 326., 328., 330., 332., 334., 336., 338., 340., 342., 344., 346., 348., 350., 352., 354., 356., 358.], dtype=float32) - time(time)datetime64[ns]2010-01-01 ... 2020-08-01
- long_name :
- Time
- delta_t :
- 0000-01-00 00:00:00
- avg_period :
- 0000-01-00 00:00:00
- prev_avg_period :
- 0000-00-07 00:00:00
- standard_name :
- time
- axis :
- T
- actual_range :
- [19723. 80566.]
array(['2010-01-01T00:00:00.000000000', '2010-02-01T00:00:00.000000000',
       '2010-03-01T00:00:00.000000000', '2010-04-01T00:00:00.000000000',
       '2010-05-01T00:00:00.000000000', '2010-06-01T00:00:00.000000000',
       '2010-07-01T00:00:00.000000000', '2010-08-01T00:00:00.000000000',
       '2010-09-01T00:00:00.000000000', '2010-10-01T00:00:00.000000000',
       '2010-11-01T00:00:00.000000000', '2010-12-01T00:00:00.000000000',
       '2011-01-01T00:00:00.000000000', '2011-02-01T00:00:00.000000000',
       '2011-03-01T00:00:00.000000000', '2011-04-01T00:00:00.000000000',
       '2011-05-01T00:00:00.000000000', '2011-06-01T00:00:00.000000000',
       '2011-07-01T00:00:00.000000000', '2011-08-01T00:00:00.000000000',
       '2011-09-01T00:00:00.000000000', '2011-10-01T00:00:00.000000000',
       '2011-11-01T00:00:00.000000000', '2011-12-01T00:00:00.000000000',
       '2012-01-01T00:00:00.000000000', '2012-02-01T00:00:00.000000000',
       '2012-03-01T00:00:00.000000000', '2012-04-01T00:00:00.000000000',
       '2012-05-01T00:00:00.000000000', '2012-06-01T00:00:00.000000000',
       '2012-07-01T00:00:00.000000000', '2012-08-01T00:00:00.000000000',
       '2012-09-01T00:00:00.000000000', '2012-10-01T00:00:00.000000000',
       '2012-11-01T00:00:00.000000000', '2012-12-01T00:00:00.000000000',
       '2013-01-01T00:00:00.000000000', '2013-02-01T00:00:00.000000000',
       '2013-03-01T00:00:00.000000000', '2013-04-01T00:00:00.000000000',
       '2013-05-01T00:00:00.000000000', '2013-06-01T00:00:00.000000000',
       '2013-07-01T00:00:00.000000000', '2013-08-01T00:00:00.000000000',
       '2013-09-01T00:00:00.000000000', '2013-10-01T00:00:00.000000000',
       '2013-11-01T00:00:00.000000000', '2013-12-01T00:00:00.000000000',
       '2014-01-01T00:00:00.000000000', '2014-02-01T00:00:00.000000000',
       '2014-03-01T00:00:00.000000000', '2014-04-01T00:00:00.000000000',
       '2014-05-01T00:00:00.000000000', '2014-06-01T00:00:00.000000000',
       '2014-07-01T00:00:00.000000000', '2014-08-01T00:00:00.000000000',
       '2014-09-01T00:00:00.000000000', '2014-10-01T00:00:00.000000000',
       '2014-11-01T00:00:00.000000000', '2014-12-01T00:00:00.000000000',
       '2015-01-01T00:00:00.000000000', '2015-02-01T00:00:00.000000000',
       '2015-03-01T00:00:00.000000000', '2015-04-01T00:00:00.000000000',
       '2015-05-01T00:00:00.000000000', '2015-06-01T00:00:00.000000000',
       '2015-07-01T00:00:00.000000000', '2015-08-01T00:00:00.000000000',
       '2015-09-01T00:00:00.000000000', '2015-10-01T00:00:00.000000000',
       '2015-11-01T00:00:00.000000000', '2015-12-01T00:00:00.000000000',
       '2016-01-01T00:00:00.000000000', '2016-02-01T00:00:00.000000000',
       '2016-03-01T00:00:00.000000000', '2016-04-01T00:00:00.000000000',
       '2016-05-01T00:00:00.000000000', '2016-06-01T00:00:00.000000000',
       '2016-07-01T00:00:00.000000000', '2016-08-01T00:00:00.000000000',
       '2016-09-01T00:00:00.000000000', '2016-10-01T00:00:00.000000000',
       '2016-11-01T00:00:00.000000000', '2016-12-01T00:00:00.000000000',
       '2017-01-01T00:00:00.000000000', '2017-02-01T00:00:00.000000000',
       '2017-03-01T00:00:00.000000000', '2017-04-01T00:00:00.000000000',
       '2017-05-01T00:00:00.000000000', '2017-06-01T00:00:00.000000000',
       '2017-07-01T00:00:00.000000000', '2017-08-01T00:00:00.000000000',
       '2017-09-01T00:00:00.000000000', '2017-10-01T00:00:00.000000000',
       '2017-11-01T00:00:00.000000000', '2017-12-01T00:00:00.000000000',
       '2018-01-01T00:00:00.000000000', '2018-02-01T00:00:00.000000000',
       '2018-03-01T00:00:00.000000000', '2018-04-01T00:00:00.000000000',
       '2018-05-01T00:00:00.000000000', '2018-06-01T00:00:00.000000000',
       '2018-07-01T00:00:00.000000000', '2018-08-01T00:00:00.000000000',
       '2018-09-01T00:00:00.000000000', '2018-10-01T00:00:00.000000000',
       '2018-11-01T00:00:00.000000000', '2018-12-01T00:00:00.000000000',
       '2019-01-01T00:00:00.000000000', '2019-02-01T00:00:00.000000000',
       '2019-03-01T00:00:00.000000000', '2019-04-01T00:00:00.000000000',
       '2019-05-01T00:00:00.000000000', '2019-06-01T00:00:00.000000000',
       '2019-07-01T00:00:00.000000000', '2019-08-01T00:00:00.000000000',
       '2019-09-01T00:00:00.000000000', '2019-10-01T00:00:00.000000000',
       '2019-11-01T00:00:00.000000000', '2019-12-01T00:00:00.000000000',
       '2020-01-01T00:00:00.000000000', '2020-02-01T00:00:00.000000000',
       '2020-03-01T00:00:00.000000000', '2020-04-01T00:00:00.000000000',
       '2020-05-01T00:00:00.000000000', '2020-06-01T00:00:00.000000000',
       '2020-07-01T00:00:00.000000000', '2020-08-01T00:00:00.000000000'],
      dtype='datetime64[ns]')
- latPandasIndex
PandasIndex(Index([ 88.0, 86.0, 84.0, 82.0, 80.0, 78.0, 76.0, 74.0, 72.0, 70.0, 68.0, 66.0, 64.0, 62.0, 60.0, 58.0, 56.0, 54.0, 52.0, 50.0, 48.0, 46.0, 44.0, 42.0, 40.0, 38.0, 36.0, 34.0, 32.0, 30.0, 28.0, 26.0, 24.0, 22.0, 20.0, 18.0, 16.0, 14.0, 12.0, 10.0, 8.0, 6.0, 4.0, 2.0, 0.0, -2.0, -4.0, -6.0, -8.0, -10.0, -12.0, -14.0, -16.0, -18.0, -20.0, -22.0, -24.0, -26.0, -28.0, -30.0, -32.0, -34.0, -36.0, -38.0, -40.0, -42.0, -44.0, -46.0, -48.0, -50.0, -52.0, -54.0, -56.0, -58.0, -60.0, -62.0, -64.0, -66.0, -68.0, -70.0, -72.0, -74.0, -76.0, -78.0, -80.0, -82.0, -84.0, -86.0, -88.0], dtype='float32', name='lat')) - lonPandasIndex
PandasIndex(Index([ 0.0, 2.0, 4.0, 6.0, 8.0, 10.0, 12.0, 14.0, 16.0, 18.0, ... 340.0, 342.0, 344.0, 346.0, 348.0, 350.0, 352.0, 354.0, 356.0, 358.0], dtype='float32', name='lon', length=180)) - timePandasIndex
PandasIndex(DatetimeIndex(['2010-01-01', '2010-02-01', '2010-03-01', '2010-04-01',
               '2010-05-01', '2010-06-01', '2010-07-01', '2010-08-01',
               '2010-09-01', '2010-10-01',
               ...
               '2019-11-01', '2019-12-01', '2020-01-01', '2020-02-01',
               '2020-03-01', '2020-04-01', '2020-05-01', '2020-06-01',
               '2020-07-01', '2020-08-01'],
              dtype='datetime64[ns]', name='time', length=128, freq=None))
- long_name :
- Monthly Means of Sea Surface Temperature
- units :
- degC
- var_desc :
- Sea Surface Temperature
- level_desc :
- Surface
- statistic :
- Mean
- dataset :
- NOAA Extended Reconstructed SST V5
- parent_stat :
- Individual Values
- actual_range :
- [-1.8 42.32636]
- valid_range :
- [-1.8 45. ]
NumPy style indexing still works (but preserves the labels/metadata)
da[:, 20, 40]
Show code cell output
Hide code cell output
<xarray.DataArray 'sst' (time: 128)> Size: 512B
array([nan, nan, nan, nan, nan, nan, nan, nan, nan, nan, nan, nan, nan, nan,
       nan, nan, nan, nan, nan, nan, nan, nan, nan, nan, nan, nan, nan, nan,
       nan, nan, nan, nan, nan, nan, nan, nan, nan, nan, nan, nan, nan, nan,
       nan, nan, nan, nan, nan, nan, nan, nan, nan, nan, nan, nan, nan, nan,
       nan, nan, nan, nan, nan, nan, nan, nan, nan, nan, nan, nan, nan, nan,
       nan, nan, nan, nan, nan, nan, nan, nan, nan, nan, nan, nan, nan, nan,
       nan, nan, nan, nan, nan, nan, nan, nan, nan, nan, nan, nan, nan, nan,
       nan, nan, nan, nan, nan, nan, nan, nan, nan, nan, nan, nan, nan, nan,
       nan, nan, nan, nan, nan, nan, nan, nan, nan, nan, nan, nan, nan, nan,
       nan, nan], dtype=float32)
Coordinates:
    lat      float32 4B 48.0
    lon      float32 4B 80.0
  * time     (time) datetime64[ns] 1kB 2010-01-01 2010-02-01 ... 2020-08-01
Attributes:
    long_name:     Monthly Means of Sea Surface Temperature
    units:         degC
    var_desc:      Sea Surface Temperature
    level_desc:    Surface
    statistic:     Mean
    dataset:       NOAA Extended Reconstructed SST V5
    parent_stat:   Individual Values
    actual_range:  [-1.8     42.32636]
valid_range: [-1.8 45. ]- time: 128
- nan nan nan nan nan nan nan nan ... nan nan nan nan nan nan nan nan
array([nan, nan, nan, nan, nan, nan, nan, nan, nan, nan, nan, nan, nan, nan, nan, nan, nan, nan, nan, nan, nan, nan, nan, nan, nan, nan, nan, nan, nan, nan, nan, nan, nan, nan, nan, nan, nan, nan, nan, nan, nan, nan, nan, nan, nan, nan, nan, nan, nan, nan, nan, nan, nan, nan, nan, nan, nan, nan, nan, nan, nan, nan, nan, nan, nan, nan, nan, nan, nan, nan, nan, nan, nan, nan, nan, nan, nan, nan, nan, nan, nan, nan, nan, nan, nan, nan, nan, nan, nan, nan, nan, nan, nan, nan, nan, nan, nan, nan, nan, nan, nan, nan, nan, nan, nan, nan, nan, nan, nan, nan, nan, nan, nan, nan, nan, nan, nan, nan, nan, nan, nan, nan, nan, nan, nan, nan, nan, nan], dtype=float32) - lat()float3248.0
- units :
- degrees_north
- long_name :
- Latitude
- actual_range :
- [ 88. -88.]
- standard_name :
- latitude
- axis :
- Y
- coordinate_defines :
- center
array(48., dtype=float32)
- lon()float3280.0
- units :
- degrees_east
- long_name :
- Longitude
- actual_range :
- [ 0. 358.]
- standard_name :
- longitude
- axis :
- X
- coordinate_defines :
- center
array(80., dtype=float32)
- time(time)datetime64[ns]2010-01-01 ... 2020-08-01
- long_name :
- Time
- delta_t :
- 0000-01-00 00:00:00
- avg_period :
- 0000-01-00 00:00:00
- prev_avg_period :
- 0000-00-07 00:00:00
- standard_name :
- time
- axis :
- T
- actual_range :
- [19723. 80566.]
array(['2010-01-01T00:00:00.000000000', '2010-02-01T00:00:00.000000000',
       '2010-03-01T00:00:00.000000000', '2010-04-01T00:00:00.000000000',
       '2010-05-01T00:00:00.000000000', '2010-06-01T00:00:00.000000000',
       '2010-07-01T00:00:00.000000000', '2010-08-01T00:00:00.000000000',
       '2010-09-01T00:00:00.000000000', '2010-10-01T00:00:00.000000000',
       '2010-11-01T00:00:00.000000000', '2010-12-01T00:00:00.000000000',
       '2011-01-01T00:00:00.000000000', '2011-02-01T00:00:00.000000000',
       '2011-03-01T00:00:00.000000000', '2011-04-01T00:00:00.000000000',
       '2011-05-01T00:00:00.000000000', '2011-06-01T00:00:00.000000000',
       '2011-07-01T00:00:00.000000000', '2011-08-01T00:00:00.000000000',
       '2011-09-01T00:00:00.000000000', '2011-10-01T00:00:00.000000000',
       '2011-11-01T00:00:00.000000000', '2011-12-01T00:00:00.000000000',
       '2012-01-01T00:00:00.000000000', '2012-02-01T00:00:00.000000000',
       '2012-03-01T00:00:00.000000000', '2012-04-01T00:00:00.000000000',
       '2012-05-01T00:00:00.000000000', '2012-06-01T00:00:00.000000000',
       '2012-07-01T00:00:00.000000000', '2012-08-01T00:00:00.000000000',
       '2012-09-01T00:00:00.000000000', '2012-10-01T00:00:00.000000000',
       '2012-11-01T00:00:00.000000000', '2012-12-01T00:00:00.000000000',
       '2013-01-01T00:00:00.000000000', '2013-02-01T00:00:00.000000000',
       '2013-03-01T00:00:00.000000000', '2013-04-01T00:00:00.000000000',
       '2013-05-01T00:00:00.000000000', '2013-06-01T00:00:00.000000000',
       '2013-07-01T00:00:00.000000000', '2013-08-01T00:00:00.000000000',
       '2013-09-01T00:00:00.000000000', '2013-10-01T00:00:00.000000000',
       '2013-11-01T00:00:00.000000000', '2013-12-01T00:00:00.000000000',
       '2014-01-01T00:00:00.000000000', '2014-02-01T00:00:00.000000000',
       '2014-03-01T00:00:00.000000000', '2014-04-01T00:00:00.000000000',
       '2014-05-01T00:00:00.000000000', '2014-06-01T00:00:00.000000000',
       '2014-07-01T00:00:00.000000000', '2014-08-01T00:00:00.000000000',
       '2014-09-01T00:00:00.000000000', '2014-10-01T00:00:00.000000000',
       '2014-11-01T00:00:00.000000000', '2014-12-01T00:00:00.000000000',
       '2015-01-01T00:00:00.000000000', '2015-02-01T00:00:00.000000000',
       '2015-03-01T00:00:00.000000000', '2015-04-01T00:00:00.000000000',
       '2015-05-01T00:00:00.000000000', '2015-06-01T00:00:00.000000000',
       '2015-07-01T00:00:00.000000000', '2015-08-01T00:00:00.000000000',
       '2015-09-01T00:00:00.000000000', '2015-10-01T00:00:00.000000000',
       '2015-11-01T00:00:00.000000000', '2015-12-01T00:00:00.000000000',
       '2016-01-01T00:00:00.000000000', '2016-02-01T00:00:00.000000000',
       '2016-03-01T00:00:00.000000000', '2016-04-01T00:00:00.000000000',
       '2016-05-01T00:00:00.000000000', '2016-06-01T00:00:00.000000000',
       '2016-07-01T00:00:00.000000000', '2016-08-01T00:00:00.000000000',
       '2016-09-01T00:00:00.000000000', '2016-10-01T00:00:00.000000000',
       '2016-11-01T00:00:00.000000000', '2016-12-01T00:00:00.000000000',
       '2017-01-01T00:00:00.000000000', '2017-02-01T00:00:00.000000000',
       '2017-03-01T00:00:00.000000000', '2017-04-01T00:00:00.000000000',
       '2017-05-01T00:00:00.000000000', '2017-06-01T00:00:00.000000000',
       '2017-07-01T00:00:00.000000000', '2017-08-01T00:00:00.000000000',
       '2017-09-01T00:00:00.000000000', '2017-10-01T00:00:00.000000000',
       '2017-11-01T00:00:00.000000000', '2017-12-01T00:00:00.000000000',
       '2018-01-01T00:00:00.000000000', '2018-02-01T00:00:00.000000000',
       '2018-03-01T00:00:00.000000000', '2018-04-01T00:00:00.000000000',
       '2018-05-01T00:00:00.000000000', '2018-06-01T00:00:00.000000000',
       '2018-07-01T00:00:00.000000000', '2018-08-01T00:00:00.000000000',
       '2018-09-01T00:00:00.000000000', '2018-10-01T00:00:00.000000000',
       '2018-11-01T00:00:00.000000000', '2018-12-01T00:00:00.000000000',
       '2019-01-01T00:00:00.000000000', '2019-02-01T00:00:00.000000000',
       '2019-03-01T00:00:00.000000000', '2019-04-01T00:00:00.000000000',
       '2019-05-01T00:00:00.000000000', '2019-06-01T00:00:00.000000000',
       '2019-07-01T00:00:00.000000000', '2019-08-01T00:00:00.000000000',
       '2019-09-01T00:00:00.000000000', '2019-10-01T00:00:00.000000000',
       '2019-11-01T00:00:00.000000000', '2019-12-01T00:00:00.000000000',
       '2020-01-01T00:00:00.000000000', '2020-02-01T00:00:00.000000000',
       '2020-03-01T00:00:00.000000000', '2020-04-01T00:00:00.000000000',
       '2020-05-01T00:00:00.000000000', '2020-06-01T00:00:00.000000000',
       '2020-07-01T00:00:00.000000000', '2020-08-01T00:00:00.000000000'],
      dtype='datetime64[ns]')
- timePandasIndex
PandasIndex(DatetimeIndex(['2010-01-01', '2010-02-01', '2010-03-01', '2010-04-01',
               '2010-05-01', '2010-06-01', '2010-07-01', '2010-08-01',
               '2010-09-01', '2010-10-01',
               ...
               '2019-11-01', '2019-12-01', '2020-01-01', '2020-02-01',
               '2020-03-01', '2020-04-01', '2020-05-01', '2020-06-01',
               '2020-07-01', '2020-08-01'],
              dtype='datetime64[ns]', name='time', length=128, freq=None))
- long_name :
- Monthly Means of Sea Surface Temperature
- units :
- degC
- var_desc :
- Sea Surface Temperature
- level_desc :
- Surface
- statistic :
- Mean
- dataset :
- NOAA Extended Reconstructed SST V5
- parent_stat :
- Individual Values
- actual_range :
- [-1.8 42.32636]
- valid_range :
- [-1.8 45. ]
Positional indexing using dimension names
da.isel(lat=60, lon=40).plot();
Label-based indexing
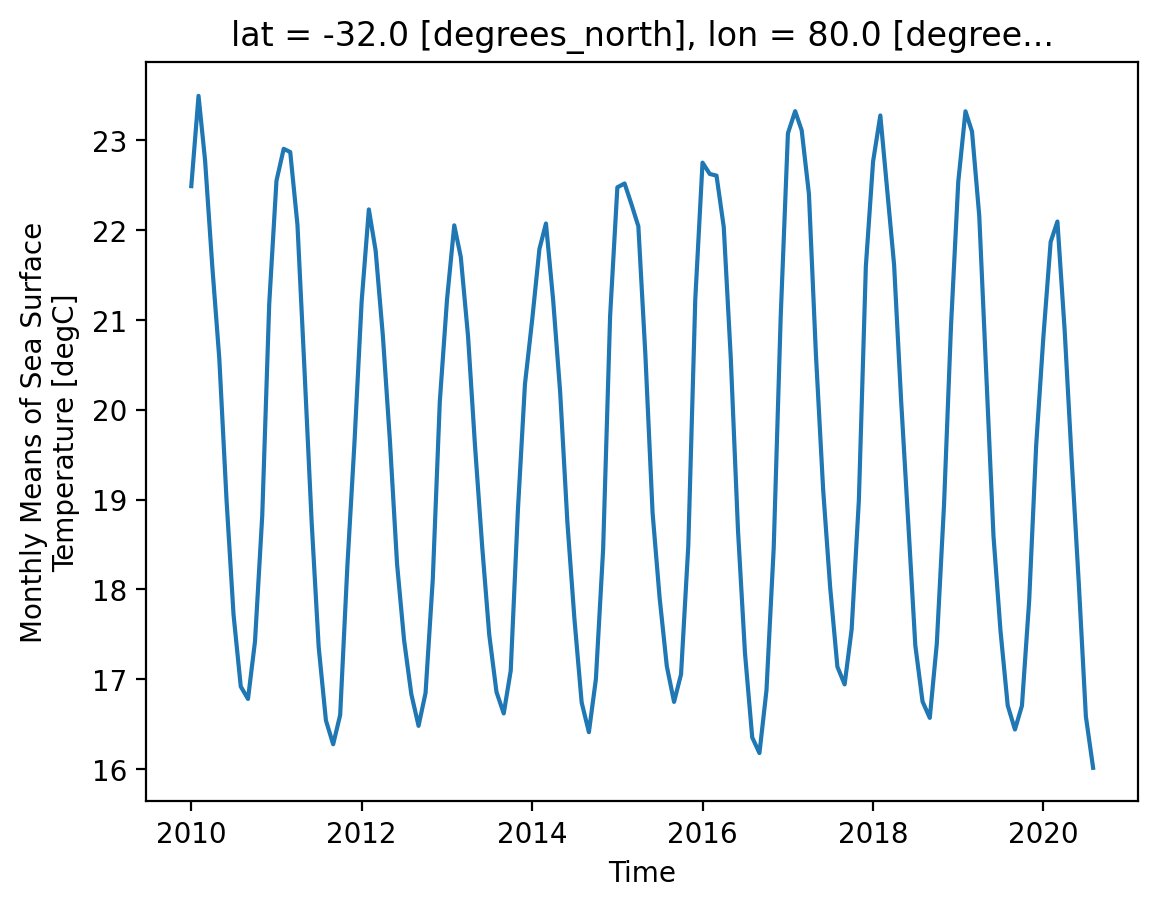
da.sel(lat=-32, lon=80).plot();
da.sel(lat=50.0, lon=200.0, time="2020")
<xarray.DataArray 'sst' (time: 8)> Size: 32B
array([ 5.501727,  5.015851,  4.808821,  5.837058,  7.285223,  8.64473 ,
       11.524967, 12.405846], dtype=float32)
Coordinates:
    lat      float32 4B 50.0
    lon      float32 4B 200.0
  * time     (time) datetime64[ns] 64B 2020-01-01 2020-02-01 ... 2020-08-01
Attributes:
    long_name:     Monthly Means of Sea Surface Temperature
    units:         degC
    var_desc:      Sea Surface Temperature
    level_desc:    Surface
    statistic:     Mean
    dataset:       NOAA Extended Reconstructed SST V5
    parent_stat:   Individual Values
    actual_range:  [-1.8     42.32636]
valid_range: [-1.8 45. ]- time: 8
- 5.502 5.016 4.809 5.837 7.285 8.645 11.52 12.41
array([ 5.501727, 5.015851, 4.808821, 5.837058, 7.285223, 8.64473 , 11.524967, 12.405846], dtype=float32) - lat()float3250.0
- units :
- degrees_north
- long_name :
- Latitude
- actual_range :
- [ 88. -88.]
- standard_name :
- latitude
- axis :
- Y
- coordinate_defines :
- center
array(50., dtype=float32)
- lon()float32200.0
- units :
- degrees_east
- long_name :
- Longitude
- actual_range :
- [ 0. 358.]
- standard_name :
- longitude
- axis :
- X
- coordinate_defines :
- center
array(200., dtype=float32)
- time(time)datetime64[ns]2020-01-01 ... 2020-08-01
- long_name :
- Time
- delta_t :
- 0000-01-00 00:00:00
- avg_period :
- 0000-01-00 00:00:00
- prev_avg_period :
- 0000-00-07 00:00:00
- standard_name :
- time
- axis :
- T
- actual_range :
- [19723. 80566.]
array(['2020-01-01T00:00:00.000000000', '2020-02-01T00:00:00.000000000',
       '2020-03-01T00:00:00.000000000', '2020-04-01T00:00:00.000000000',
       '2020-05-01T00:00:00.000000000', '2020-06-01T00:00:00.000000000',
       '2020-07-01T00:00:00.000000000', '2020-08-01T00:00:00.000000000'],
      dtype='datetime64[ns]')
- timePandasIndex
PandasIndex(DatetimeIndex(['2020-01-01', '2020-02-01', '2020-03-01', '2020-04-01',
               '2020-05-01', '2020-06-01', '2020-07-01', '2020-08-01'],
              dtype='datetime64[ns]', name='time', freq=None))
- long_name :
- Monthly Means of Sea Surface Temperature
- units :
- degC
- var_desc :
- Sea Surface Temperature
- level_desc :
- Surface
- statistic :
- Mean
- dataset :
- NOAA Extended Reconstructed SST V5
- parent_stat :
- Individual Values
- actual_range :
- [-1.8 42.32636]
- valid_range :
- [-1.8 45. ]
# demonstrate slicing
ds.sel(time=slice("2019-05", "2020-07"))
<xarray.Dataset> Size: 962kB
Dimensions:  (lat: 89, lon: 180, time: 15)
Coordinates:
  * lat      (lat) float32 356B 88.0 86.0 84.0 82.0 ... -82.0 -84.0 -86.0 -88.0
  * lon      (lon) float32 720B 0.0 2.0 4.0 6.0 8.0 ... 352.0 354.0 356.0 358.0
  * time     (time) datetime64[ns] 120B 2019-05-01 2019-06-01 ... 2020-07-01
Data variables:
    sst      (time, lat, lon) float32 961kB -1.8 -1.8 -1.8 -1.8 ... nan nan nan
Attributes: (12/37)
    climatology:               Climatology is based on 1971-2000 SST, Xue, Y....
    description:               In situ data: ICOADS2.5 before 2007 and NCEP i...
    keywords_vocabulary:       NASA Global Change Master Directory (GCMD) Sci...
    keywords:                  Earth Science > Oceans > Ocean Temperature > S...
    instrument:                Conventional thermometers
    source_comment:            SSTs were observed by conventional thermometer...
    ...                        ...
    creator_url_original:      https://www.ncei.noaa.gov
    license:                   No constraints on data access or use
    comment:                   SSTs were observed by conventional thermometer...
    summary:                   ERSST.v5 is developed based on v4 after revisi...
    dataset_title:             NOAA Extended Reconstructed SST V5
data_modified: 2020-09-07- lat: 89
- lon: 180
- time: 15
- lat(lat)float3288.0 86.0 84.0 ... -86.0 -88.0
- units :
- degrees_north
- long_name :
- Latitude
- actual_range :
- [ 88. -88.]
- standard_name :
- latitude
- axis :
- Y
- coordinate_defines :
- center
array([ 88., 86., 84., 82., 80., 78., 76., 74., 72., 70., 68., 66., 64., 62., 60., 58., 56., 54., 52., 50., 48., 46., 44., 42., 40., 38., 36., 34., 32., 30., 28., 26., 24., 22., 20., 18., 16., 14., 12., 10., 8., 6., 4., 2., 0., -2., -4., -6., -8., -10., -12., -14., -16., -18., -20., -22., -24., -26., -28., -30., -32., -34., -36., -38., -40., -42., -44., -46., -48., -50., -52., -54., -56., -58., -60., -62., -64., -66., -68., -70., -72., -74., -76., -78., -80., -82., -84., -86., -88.], dtype=float32) - lon(lon)float320.0 2.0 4.0 ... 354.0 356.0 358.0
- units :
- degrees_east
- long_name :
- Longitude
- actual_range :
- [ 0. 358.]
- standard_name :
- longitude
- axis :
- X
- coordinate_defines :
- center
array([ 0., 2., 4., 6., 8., 10., 12., 14., 16., 18., 20., 22., 24., 26., 28., 30., 32., 34., 36., 38., 40., 42., 44., 46., 48., 50., 52., 54., 56., 58., 60., 62., 64., 66., 68., 70., 72., 74., 76., 78., 80., 82., 84., 86., 88., 90., 92., 94., 96., 98., 100., 102., 104., 106., 108., 110., 112., 114., 116., 118., 120., 122., 124., 126., 128., 130., 132., 134., 136., 138., 140., 142., 144., 146., 148., 150., 152., 154., 156., 158., 160., 162., 164., 166., 168., 170., 172., 174., 176., 178., 180., 182., 184., 186., 188., 190., 192., 194., 196., 198., 200., 202., 204., 206., 208., 210., 212., 214., 216., 218., 220., 222., 224., 226., 228., 230., 232., 234., 236., 238., 240., 242., 244., 246., 248., 250., 252., 254., 256., 258., 260., 262., 264., 266., 268., 270., 272., 274., 276., 278., 280., 282., 284., 286., 288., 290., 292., 294., 296., 298., 300., 302., 304., 306., 308., 310., 312., 314., 316., 318., 320., 322., 324., 326., 328., 330., 332., 334., 336., 338., 340., 342., 344., 346., 348., 350., 352., 354., 356., 358.], dtype=float32) - time(time)datetime64[ns]2019-05-01 ... 2020-07-01
- long_name :
- Time
- delta_t :
- 0000-01-00 00:00:00
- avg_period :
- 0000-01-00 00:00:00
- prev_avg_period :
- 0000-00-07 00:00:00
- standard_name :
- time
- axis :
- T
- actual_range :
- [19723. 80566.]
array(['2019-05-01T00:00:00.000000000', '2019-06-01T00:00:00.000000000',
       '2019-07-01T00:00:00.000000000', '2019-08-01T00:00:00.000000000',
       '2019-09-01T00:00:00.000000000', '2019-10-01T00:00:00.000000000',
       '2019-11-01T00:00:00.000000000', '2019-12-01T00:00:00.000000000',
       '2020-01-01T00:00:00.000000000', '2020-02-01T00:00:00.000000000',
       '2020-03-01T00:00:00.000000000', '2020-04-01T00:00:00.000000000',
       '2020-05-01T00:00:00.000000000', '2020-06-01T00:00:00.000000000',
       '2020-07-01T00:00:00.000000000'], dtype='datetime64[ns]')
- sst(time, lat, lon)float32-1.8 -1.8 -1.8 -1.8 ... nan nan nan
- long_name :
- Monthly Means of Sea Surface Temperature
- units :
- degC
- var_desc :
- Sea Surface Temperature
- level_desc :
- Surface
- statistic :
- Mean
- dataset :
- NOAA Extended Reconstructed SST V5
- parent_stat :
- Individual Values
- actual_range :
- [-1.8 42.32636]
- valid_range :
- [-1.8 45. ]
array([[[-1.8, -1.8, ..., -1.8, -1.8],
        [-1.8, -1.8, ..., -1.8, -1.8],
        ...,
        [ nan,  nan, ...,  nan,  nan],
        [ nan,  nan, ...,  nan,  nan]],

       [[-1.8, -1.8, ..., -1.8, -1.8],
        [-1.8, -1.8, ..., -1.8, -1.8],
        ...,
        [ nan,  nan, ...,  nan,  nan],
        [ nan,  nan, ...,  nan,  nan]],

       ...,

       [[-1.8, -1.8, ..., -1.8, -1.8],
        [-1.8, -1.8, ..., -1.8, -1.8],
        ...,
        [ nan,  nan, ...,  nan,  nan],
        [ nan,  nan, ...,  nan,  nan]],

       [[-1.8, -1.8, ..., -1.8, -1.8],
        [-1.8, -1.8, ..., -1.8, -1.8],
        ...,
        [ nan,  nan, ...,  nan,  nan],
        [ nan,  nan, ...,  nan,  nan]]], shape=(15, 89, 180), dtype=float32)
- latPandasIndex
PandasIndex(Index([ 88.0, 86.0, 84.0, 82.0, 80.0, 78.0, 76.0, 74.0, 72.0, 70.0, 68.0, 66.0, 64.0, 62.0, 60.0, 58.0, 56.0, 54.0, 52.0, 50.0, 48.0, 46.0, 44.0, 42.0, 40.0, 38.0, 36.0, 34.0, 32.0, 30.0, 28.0, 26.0, 24.0, 22.0, 20.0, 18.0, 16.0, 14.0, 12.0, 10.0, 8.0, 6.0, 4.0, 2.0, 0.0, -2.0, -4.0, -6.0, -8.0, -10.0, -12.0, -14.0, -16.0, -18.0, -20.0, -22.0, -24.0, -26.0, -28.0, -30.0, -32.0, -34.0, -36.0, -38.0, -40.0, -42.0, -44.0, -46.0, -48.0, -50.0, -52.0, -54.0, -56.0, -58.0, -60.0, -62.0, -64.0, -66.0, -68.0, -70.0, -72.0, -74.0, -76.0, -78.0, -80.0, -82.0, -84.0, -86.0, -88.0], dtype='float32', name='lat')) - lonPandasIndex
PandasIndex(Index([ 0.0, 2.0, 4.0, 6.0, 8.0, 10.0, 12.0, 14.0, 16.0, 18.0, ... 340.0, 342.0, 344.0, 346.0, 348.0, 350.0, 352.0, 354.0, 356.0, 358.0], dtype='float32', name='lon', length=180)) - timePandasIndex
PandasIndex(DatetimeIndex(['2019-05-01', '2019-06-01', '2019-07-01', '2019-08-01',
               '2019-09-01', '2019-10-01', '2019-11-01', '2019-12-01',
               '2020-01-01', '2020-02-01', '2020-03-01', '2020-04-01',
               '2020-05-01', '2020-06-01', '2020-07-01'],
              dtype='datetime64[ns]', name='time', freq=None))
- climatology :
- Climatology is based on 1971-2000 SST, Xue, Y., T. M. Smith, and R. W. Reynolds, 2003: Interdecadal changes of 30-yr SST normals during 1871.2000. Journal of Climate, 16, 1601-1612.
- description :
- In situ data: ICOADS2.5 before 2007 and NCEP in situ data from 2008 to present. Ice data: HadISST ice before 2010 and NCEP ice after 2010.
- keywords_vocabulary :
- NASA Global Change Master Directory (GCMD) Science Keywords
- keywords :
- Earth Science > Oceans > Ocean Temperature > Sea Surface Temperature >
- instrument :
- Conventional thermometers
- source_comment :
- SSTs were observed by conventional thermometers in Buckets (insulated or un-insulated canvas and wooded buckets) or Engine Room Intaker
- geospatial_lon_min :
- -1.0
- geospatial_lon_max :
- 359.0
- geospatial_laty_max :
- 89.0
- geospatial_laty_min :
- -89.0
- geospatial_lat_max :
- 89.0
- geospatial_lat_min :
- -89.0
- geospatial_lat_units :
- degrees_north
- geospatial_lon_units :
- degrees_east
- cdm_data_type :
- Grid
- project :
- NOAA Extended Reconstructed Sea Surface Temperature (ERSST)
- original_publisher_url :
- http://www.ncdc.noaa.gov
- References :
- https://www.ncdc.noaa.gov/data-access/marineocean-data/extended-reconstructed-sea-surface-temperature-ersst-v5 at NCEI and http://www.esrl.noaa.gov/psd/data/gridded/data.noaa.ersst.v5.html
- source :
- In situ data: ICOADS R3.0 before 2015, NCEP in situ GTS from 2016 to present, and Argo SST from 1999 to present. Ice data: HadISST2 ice before 2015, and NCEP ice after 2015
- title :
- NOAA ERSSTv5 (in situ only)
- history :
- created 07/2017 by PSD data using NCEI's ERSST V5 NetCDF values
- institution :
- This version written at NOAA/ESRL PSD: obtained from NOAA/NESDIS/National Centers for Environmental Information and time aggregated. Original Full Source: NOAA/NESDIS/NCEI/CCOG
- citation :
- Huang et al, 2017: Extended Reconstructed Sea Surface Temperatures Version 5 (ERSSTv5): Upgrades, Validations, and Intercomparisons. Journal of Climate, https://doi.org/10.1175/JCLI-D-16-0836.1
- platform :
- Ship and Buoy SSTs from ICOADS R3.0 and NCEP GTS
- standard_name_vocabulary :
- CF Standard Name Table (v40, 25 January 2017)
- processing_level :
- NOAA Level 4
- Conventions :
- CF-1.6, ACDD-1.3
- metadata_link :
- :metadata_link = https://doi.org/10.7289/V5T72FNM (original format)
- creator_name :
- Boyin Huang (original)
- date_created :
- 2017-06-30T12:18:00Z (original)
- product_version :
- Version 5
- creator_url_original :
- https://www.ncei.noaa.gov
- license :
- No constraints on data access or use
- comment :
- SSTs were observed by conventional thermometers in Buckets (insulated or un-insulated canvas and wooded buckets), Engine Room Intakers, or floats and drifters
- summary :
- ERSST.v5 is developed based on v4 after revisions of 8 parameters using updated data sets and advanced knowledge of ERSST analysis
- dataset_title :
- NOAA Extended Reconstructed SST V5
- data_modified :
- 2020-09-07
Nearest Neighbor Lookups
da.sel(lat=52.25, lon=251.8998, method="nearest")
Show code cell output
Hide code cell output
<xarray.DataArray 'sst' (time: 128)> Size: 512B
array([nan, nan, nan, nan, nan, nan, nan, nan, nan, nan, nan, nan, nan, nan,
       nan, nan, nan, nan, nan, nan, nan, nan, nan, nan, nan, nan, nan, nan,
       nan, nan, nan, nan, nan, nan, nan, nan, nan, nan, nan, nan, nan, nan,
       nan, nan, nan, nan, nan, nan, nan, nan, nan, nan, nan, nan, nan, nan,
       nan, nan, nan, nan, nan, nan, nan, nan, nan, nan, nan, nan, nan, nan,
       nan, nan, nan, nan, nan, nan, nan, nan, nan, nan, nan, nan, nan, nan,
       nan, nan, nan, nan, nan, nan, nan, nan, nan, nan, nan, nan, nan, nan,
       nan, nan, nan, nan, nan, nan, nan, nan, nan, nan, nan, nan, nan, nan,
       nan, nan, nan, nan, nan, nan, nan, nan, nan, nan, nan, nan, nan, nan,
       nan, nan], dtype=float32)
Coordinates:
    lat      float32 4B 52.0
    lon      float32 4B 252.0
  * time     (time) datetime64[ns] 1kB 2010-01-01 2010-02-01 ... 2020-08-01
Attributes:
    long_name:     Monthly Means of Sea Surface Temperature
    units:         degC
    var_desc:      Sea Surface Temperature
    level_desc:    Surface
    statistic:     Mean
    dataset:       NOAA Extended Reconstructed SST V5
    parent_stat:   Individual Values
    actual_range:  [-1.8     42.32636]
valid_range: [-1.8 45. ]- time: 128
- nan nan nan nan nan nan nan nan ... nan nan nan nan nan nan nan nan
array([nan, nan, nan, nan, nan, nan, nan, nan, nan, nan, nan, nan, nan, nan, nan, nan, nan, nan, nan, nan, nan, nan, nan, nan, nan, nan, nan, nan, nan, nan, nan, nan, nan, nan, nan, nan, nan, nan, nan, nan, nan, nan, nan, nan, nan, nan, nan, nan, nan, nan, nan, nan, nan, nan, nan, nan, nan, nan, nan, nan, nan, nan, nan, nan, nan, nan, nan, nan, nan, nan, nan, nan, nan, nan, nan, nan, nan, nan, nan, nan, nan, nan, nan, nan, nan, nan, nan, nan, nan, nan, nan, nan, nan, nan, nan, nan, nan, nan, nan, nan, nan, nan, nan, nan, nan, nan, nan, nan, nan, nan, nan, nan, nan, nan, nan, nan, nan, nan, nan, nan, nan, nan, nan, nan, nan, nan, nan, nan], dtype=float32) - lat()float3252.0
- units :
- degrees_north
- long_name :
- Latitude
- actual_range :
- [ 88. -88.]
- standard_name :
- latitude
- axis :
- Y
- coordinate_defines :
- center
array(52., dtype=float32)
- lon()float32252.0
- units :
- degrees_east
- long_name :
- Longitude
- actual_range :
- [ 0. 358.]
- standard_name :
- longitude
- axis :
- X
- coordinate_defines :
- center
array(252., dtype=float32)
- time(time)datetime64[ns]2010-01-01 ... 2020-08-01
- long_name :
- Time
- delta_t :
- 0000-01-00 00:00:00
- avg_period :
- 0000-01-00 00:00:00
- prev_avg_period :
- 0000-00-07 00:00:00
- standard_name :
- time
- axis :
- T
- actual_range :
- [19723. 80566.]
array(['2010-01-01T00:00:00.000000000', '2010-02-01T00:00:00.000000000',
       '2010-03-01T00:00:00.000000000', '2010-04-01T00:00:00.000000000',
       '2010-05-01T00:00:00.000000000', '2010-06-01T00:00:00.000000000',
       '2010-07-01T00:00:00.000000000', '2010-08-01T00:00:00.000000000',
       '2010-09-01T00:00:00.000000000', '2010-10-01T00:00:00.000000000',
       '2010-11-01T00:00:00.000000000', '2010-12-01T00:00:00.000000000',
       '2011-01-01T00:00:00.000000000', '2011-02-01T00:00:00.000000000',
       '2011-03-01T00:00:00.000000000', '2011-04-01T00:00:00.000000000',
       '2011-05-01T00:00:00.000000000', '2011-06-01T00:00:00.000000000',
       '2011-07-01T00:00:00.000000000', '2011-08-01T00:00:00.000000000',
       '2011-09-01T00:00:00.000000000', '2011-10-01T00:00:00.000000000',
       '2011-11-01T00:00:00.000000000', '2011-12-01T00:00:00.000000000',
       '2012-01-01T00:00:00.000000000', '2012-02-01T00:00:00.000000000',
       '2012-03-01T00:00:00.000000000', '2012-04-01T00:00:00.000000000',
       '2012-05-01T00:00:00.000000000', '2012-06-01T00:00:00.000000000',
       '2012-07-01T00:00:00.000000000', '2012-08-01T00:00:00.000000000',
       '2012-09-01T00:00:00.000000000', '2012-10-01T00:00:00.000000000',
       '2012-11-01T00:00:00.000000000', '2012-12-01T00:00:00.000000000',
       '2013-01-01T00:00:00.000000000', '2013-02-01T00:00:00.000000000',
       '2013-03-01T00:00:00.000000000', '2013-04-01T00:00:00.000000000',
       '2013-05-01T00:00:00.000000000', '2013-06-01T00:00:00.000000000',
       '2013-07-01T00:00:00.000000000', '2013-08-01T00:00:00.000000000',
       '2013-09-01T00:00:00.000000000', '2013-10-01T00:00:00.000000000',
       '2013-11-01T00:00:00.000000000', '2013-12-01T00:00:00.000000000',
       '2014-01-01T00:00:00.000000000', '2014-02-01T00:00:00.000000000',
       '2014-03-01T00:00:00.000000000', '2014-04-01T00:00:00.000000000',
       '2014-05-01T00:00:00.000000000', '2014-06-01T00:00:00.000000000',
       '2014-07-01T00:00:00.000000000', '2014-08-01T00:00:00.000000000',
       '2014-09-01T00:00:00.000000000', '2014-10-01T00:00:00.000000000',
       '2014-11-01T00:00:00.000000000', '2014-12-01T00:00:00.000000000',
       '2015-01-01T00:00:00.000000000', '2015-02-01T00:00:00.000000000',
       '2015-03-01T00:00:00.000000000', '2015-04-01T00:00:00.000000000',
       '2015-05-01T00:00:00.000000000', '2015-06-01T00:00:00.000000000',
       '2015-07-01T00:00:00.000000000', '2015-08-01T00:00:00.000000000',
       '2015-09-01T00:00:00.000000000', '2015-10-01T00:00:00.000000000',
       '2015-11-01T00:00:00.000000000', '2015-12-01T00:00:00.000000000',
       '2016-01-01T00:00:00.000000000', '2016-02-01T00:00:00.000000000',
       '2016-03-01T00:00:00.000000000', '2016-04-01T00:00:00.000000000',
       '2016-05-01T00:00:00.000000000', '2016-06-01T00:00:00.000000000',
       '2016-07-01T00:00:00.000000000', '2016-08-01T00:00:00.000000000',
       '2016-09-01T00:00:00.000000000', '2016-10-01T00:00:00.000000000',
       '2016-11-01T00:00:00.000000000', '2016-12-01T00:00:00.000000000',
       '2017-01-01T00:00:00.000000000', '2017-02-01T00:00:00.000000000',
       '2017-03-01T00:00:00.000000000', '2017-04-01T00:00:00.000000000',
       '2017-05-01T00:00:00.000000000', '2017-06-01T00:00:00.000000000',
       '2017-07-01T00:00:00.000000000', '2017-08-01T00:00:00.000000000',
       '2017-09-01T00:00:00.000000000', '2017-10-01T00:00:00.000000000',
       '2017-11-01T00:00:00.000000000', '2017-12-01T00:00:00.000000000',
       '2018-01-01T00:00:00.000000000', '2018-02-01T00:00:00.000000000',
       '2018-03-01T00:00:00.000000000', '2018-04-01T00:00:00.000000000',
       '2018-05-01T00:00:00.000000000', '2018-06-01T00:00:00.000000000',
       '2018-07-01T00:00:00.000000000', '2018-08-01T00:00:00.000000000',
       '2018-09-01T00:00:00.000000000', '2018-10-01T00:00:00.000000000',
       '2018-11-01T00:00:00.000000000', '2018-12-01T00:00:00.000000000',
       '2019-01-01T00:00:00.000000000', '2019-02-01T00:00:00.000000000',
       '2019-03-01T00:00:00.000000000', '2019-04-01T00:00:00.000000000',
       '2019-05-01T00:00:00.000000000', '2019-06-01T00:00:00.000000000',
       '2019-07-01T00:00:00.000000000', '2019-08-01T00:00:00.000000000',
       '2019-09-01T00:00:00.000000000', '2019-10-01T00:00:00.000000000',
       '2019-11-01T00:00:00.000000000', '2019-12-01T00:00:00.000000000',
       '2020-01-01T00:00:00.000000000', '2020-02-01T00:00:00.000000000',
       '2020-03-01T00:00:00.000000000', '2020-04-01T00:00:00.000000000',
       '2020-05-01T00:00:00.000000000', '2020-06-01T00:00:00.000000000',
       '2020-07-01T00:00:00.000000000', '2020-08-01T00:00:00.000000000'],
      dtype='datetime64[ns]')
- timePandasIndex
PandasIndex(DatetimeIndex(['2010-01-01', '2010-02-01', '2010-03-01', '2010-04-01',
               '2010-05-01', '2010-06-01', '2010-07-01', '2010-08-01',
               '2010-09-01', '2010-10-01',
               ...
               '2019-11-01', '2019-12-01', '2020-01-01', '2020-02-01',
               '2020-03-01', '2020-04-01', '2020-05-01', '2020-06-01',
               '2020-07-01', '2020-08-01'],
              dtype='datetime64[ns]', name='time', length=128, freq=None))
- long_name :
- Monthly Means of Sea Surface Temperature
- units :
- degC
- var_desc :
- Sea Surface Temperature
- level_desc :
- Surface
- statistic :
- Mean
- dataset :
- NOAA Extended Reconstructed SST V5
- parent_stat :
- Individual Values
- actual_range :
- [-1.8 42.32636]
- valid_range :
- [-1.8 45. ]
All of these indexing methods work on the dataset too:
ds.sel(lat=52.25, lon=251.8998, method="nearest")
<xarray.Dataset> Size: 2kB
Dimensions:  (time: 128)
Coordinates:
    lat      float32 4B 52.0
    lon      float32 4B 252.0
  * time     (time) datetime64[ns] 1kB 2010-01-01 2010-02-01 ... 2020-08-01
Data variables:
    sst      (time) float32 512B nan nan nan nan nan nan ... nan nan nan nan nan
Attributes: (12/37)
    climatology:               Climatology is based on 1971-2000 SST, Xue, Y....
    description:               In situ data: ICOADS2.5 before 2007 and NCEP i...
    keywords_vocabulary:       NASA Global Change Master Directory (GCMD) Sci...
    keywords:                  Earth Science > Oceans > Ocean Temperature > S...
    instrument:                Conventional thermometers
    source_comment:            SSTs were observed by conventional thermometer...
    ...                        ...
    creator_url_original:      https://www.ncei.noaa.gov
    license:                   No constraints on data access or use
    comment:                   SSTs were observed by conventional thermometer...
    summary:                   ERSST.v5 is developed based on v4 after revisi...
    dataset_title:             NOAA Extended Reconstructed SST V5
data_modified: 2020-09-07- time: 128
- lat()float3252.0
- units :
- degrees_north
- long_name :
- Latitude
- actual_range :
- [ 88. -88.]
- standard_name :
- latitude
- axis :
- Y
- coordinate_defines :
- center
array(52., dtype=float32)
- lon()float32252.0
- units :
- degrees_east
- long_name :
- Longitude
- actual_range :
- [ 0. 358.]
- standard_name :
- longitude
- axis :
- X
- coordinate_defines :
- center
array(252., dtype=float32)
- time(time)datetime64[ns]2010-01-01 ... 2020-08-01
- long_name :
- Time
- delta_t :
- 0000-01-00 00:00:00
- avg_period :
- 0000-01-00 00:00:00
- prev_avg_period :
- 0000-00-07 00:00:00
- standard_name :
- time
- axis :
- T
- actual_range :
- [19723. 80566.]
array(['2010-01-01T00:00:00.000000000', '2010-02-01T00:00:00.000000000',
       '2010-03-01T00:00:00.000000000', '2010-04-01T00:00:00.000000000',
       '2010-05-01T00:00:00.000000000', '2010-06-01T00:00:00.000000000',
       '2010-07-01T00:00:00.000000000', '2010-08-01T00:00:00.000000000',
       '2010-09-01T00:00:00.000000000', '2010-10-01T00:00:00.000000000',
       '2010-11-01T00:00:00.000000000', '2010-12-01T00:00:00.000000000',
       '2011-01-01T00:00:00.000000000', '2011-02-01T00:00:00.000000000',
       '2011-03-01T00:00:00.000000000', '2011-04-01T00:00:00.000000000',
       '2011-05-01T00:00:00.000000000', '2011-06-01T00:00:00.000000000',
       '2011-07-01T00:00:00.000000000', '2011-08-01T00:00:00.000000000',
       '2011-09-01T00:00:00.000000000', '2011-10-01T00:00:00.000000000',
       '2011-11-01T00:00:00.000000000', '2011-12-01T00:00:00.000000000',
       '2012-01-01T00:00:00.000000000', '2012-02-01T00:00:00.000000000',
       '2012-03-01T00:00:00.000000000', '2012-04-01T00:00:00.000000000',
       '2012-05-01T00:00:00.000000000', '2012-06-01T00:00:00.000000000',
       '2012-07-01T00:00:00.000000000', '2012-08-01T00:00:00.000000000',
       '2012-09-01T00:00:00.000000000', '2012-10-01T00:00:00.000000000',
       '2012-11-01T00:00:00.000000000', '2012-12-01T00:00:00.000000000',
       '2013-01-01T00:00:00.000000000', '2013-02-01T00:00:00.000000000',
       '2013-03-01T00:00:00.000000000', '2013-04-01T00:00:00.000000000',
       '2013-05-01T00:00:00.000000000', '2013-06-01T00:00:00.000000000',
       '2013-07-01T00:00:00.000000000', '2013-08-01T00:00:00.000000000',
       '2013-09-01T00:00:00.000000000', '2013-10-01T00:00:00.000000000',
       '2013-11-01T00:00:00.000000000', '2013-12-01T00:00:00.000000000',
       '2014-01-01T00:00:00.000000000', '2014-02-01T00:00:00.000000000',
       '2014-03-01T00:00:00.000000000', '2014-04-01T00:00:00.000000000',
       '2014-05-01T00:00:00.000000000', '2014-06-01T00:00:00.000000000',
       '2014-07-01T00:00:00.000000000', '2014-08-01T00:00:00.000000000',
       '2014-09-01T00:00:00.000000000', '2014-10-01T00:00:00.000000000',
       '2014-11-01T00:00:00.000000000', '2014-12-01T00:00:00.000000000',
       '2015-01-01T00:00:00.000000000', '2015-02-01T00:00:00.000000000',
       '2015-03-01T00:00:00.000000000', '2015-04-01T00:00:00.000000000',
       '2015-05-01T00:00:00.000000000', '2015-06-01T00:00:00.000000000',
       '2015-07-01T00:00:00.000000000', '2015-08-01T00:00:00.000000000',
       '2015-09-01T00:00:00.000000000', '2015-10-01T00:00:00.000000000',
       '2015-11-01T00:00:00.000000000', '2015-12-01T00:00:00.000000000',
       '2016-01-01T00:00:00.000000000', '2016-02-01T00:00:00.000000000',
       '2016-03-01T00:00:00.000000000', '2016-04-01T00:00:00.000000000',
       '2016-05-01T00:00:00.000000000', '2016-06-01T00:00:00.000000000',
       '2016-07-01T00:00:00.000000000', '2016-08-01T00:00:00.000000000',
       '2016-09-01T00:00:00.000000000', '2016-10-01T00:00:00.000000000',
       '2016-11-01T00:00:00.000000000', '2016-12-01T00:00:00.000000000',
       '2017-01-01T00:00:00.000000000', '2017-02-01T00:00:00.000000000',
       '2017-03-01T00:00:00.000000000', '2017-04-01T00:00:00.000000000',
       '2017-05-01T00:00:00.000000000', '2017-06-01T00:00:00.000000000',
       '2017-07-01T00:00:00.000000000', '2017-08-01T00:00:00.000000000',
       '2017-09-01T00:00:00.000000000', '2017-10-01T00:00:00.000000000',
       '2017-11-01T00:00:00.000000000', '2017-12-01T00:00:00.000000000',
       '2018-01-01T00:00:00.000000000', '2018-02-01T00:00:00.000000000',
       '2018-03-01T00:00:00.000000000', '2018-04-01T00:00:00.000000000',
       '2018-05-01T00:00:00.000000000', '2018-06-01T00:00:00.000000000',
       '2018-07-01T00:00:00.000000000', '2018-08-01T00:00:00.000000000',
       '2018-09-01T00:00:00.000000000', '2018-10-01T00:00:00.000000000',
       '2018-11-01T00:00:00.000000000', '2018-12-01T00:00:00.000000000',
       '2019-01-01T00:00:00.000000000', '2019-02-01T00:00:00.000000000',
       '2019-03-01T00:00:00.000000000', '2019-04-01T00:00:00.000000000',
       '2019-05-01T00:00:00.000000000', '2019-06-01T00:00:00.000000000',
       '2019-07-01T00:00:00.000000000', '2019-08-01T00:00:00.000000000',
       '2019-09-01T00:00:00.000000000', '2019-10-01T00:00:00.000000000',
       '2019-11-01T00:00:00.000000000', '2019-12-01T00:00:00.000000000',
       '2020-01-01T00:00:00.000000000', '2020-02-01T00:00:00.000000000',
       '2020-03-01T00:00:00.000000000', '2020-04-01T00:00:00.000000000',
       '2020-05-01T00:00:00.000000000', '2020-06-01T00:00:00.000000000',
       '2020-07-01T00:00:00.000000000', '2020-08-01T00:00:00.000000000'],
      dtype='datetime64[ns]')
- sst(time)float32nan nan nan nan ... nan nan nan nan
- long_name :
- Monthly Means of Sea Surface Temperature
- units :
- degC
- var_desc :
- Sea Surface Temperature
- level_desc :
- Surface
- statistic :
- Mean
- dataset :
- NOAA Extended Reconstructed SST V5
- parent_stat :
- Individual Values
- actual_range :
- [-1.8 42.32636]
- valid_range :
- [-1.8 45. ]
array([nan, nan, nan, nan, nan, nan, nan, nan, nan, nan, nan, nan, nan, nan,
       nan, nan, nan, nan, nan, nan, nan, nan, nan, nan, nan, nan, nan, nan,
       nan, nan, nan, nan, nan, nan, nan, nan, nan, nan, nan, nan, nan, nan,
       nan, nan, nan, nan, nan, nan, nan, nan, nan, nan, nan, nan, nan, nan,
       nan, nan, nan, nan, nan, nan, nan, nan, nan, nan, nan, nan, nan, nan,
       nan, nan, nan, nan, nan, nan, nan, nan, nan, nan, nan, nan, nan, nan,
       nan, nan, nan, nan, nan, nan, nan, nan, nan, nan, nan, nan, nan, nan,
       nan, nan, nan, nan, nan, nan, nan, nan, nan, nan, nan, nan, nan, nan,
       nan, nan, nan, nan, nan, nan, nan, nan, nan, nan, nan, nan, nan, nan,
       nan, nan], dtype=float32)
- timePandasIndex
PandasIndex(DatetimeIndex(['2010-01-01', '2010-02-01', '2010-03-01', '2010-04-01',
               '2010-05-01', '2010-06-01', '2010-07-01', '2010-08-01',
               '2010-09-01', '2010-10-01',
               ...
               '2019-11-01', '2019-12-01', '2020-01-01', '2020-02-01',
               '2020-03-01', '2020-04-01', '2020-05-01', '2020-06-01',
               '2020-07-01', '2020-08-01'],
              dtype='datetime64[ns]', name='time', length=128, freq=None))
- climatology :
- Climatology is based on 1971-2000 SST, Xue, Y., T. M. Smith, and R. W. Reynolds, 2003: Interdecadal changes of 30-yr SST normals during 1871.2000. Journal of Climate, 16, 1601-1612.
- description :
- In situ data: ICOADS2.5 before 2007 and NCEP in situ data from 2008 to present. Ice data: HadISST ice before 2010 and NCEP ice after 2010.
- keywords_vocabulary :
- NASA Global Change Master Directory (GCMD) Science Keywords
- keywords :
- Earth Science > Oceans > Ocean Temperature > Sea Surface Temperature >
- instrument :
- Conventional thermometers
- source_comment :
- SSTs were observed by conventional thermometers in Buckets (insulated or un-insulated canvas and wooded buckets) or Engine Room Intaker
- geospatial_lon_min :
- -1.0
- geospatial_lon_max :
- 359.0
- geospatial_laty_max :
- 89.0
- geospatial_laty_min :
- -89.0
- geospatial_lat_max :
- 89.0
- geospatial_lat_min :
- -89.0
- geospatial_lat_units :
- degrees_north
- geospatial_lon_units :
- degrees_east
- cdm_data_type :
- Grid
- project :
- NOAA Extended Reconstructed Sea Surface Temperature (ERSST)
- original_publisher_url :
- http://www.ncdc.noaa.gov
- References :
- https://www.ncdc.noaa.gov/data-access/marineocean-data/extended-reconstructed-sea-surface-temperature-ersst-v5 at NCEI and http://www.esrl.noaa.gov/psd/data/gridded/data.noaa.ersst.v5.html
- source :
- In situ data: ICOADS R3.0 before 2015, NCEP in situ GTS from 2016 to present, and Argo SST from 1999 to present. Ice data: HadISST2 ice before 2015, and NCEP ice after 2015
- title :
- NOAA ERSSTv5 (in situ only)
- history :
- created 07/2017 by PSD data using NCEI's ERSST V5 NetCDF values
- institution :
- This version written at NOAA/ESRL PSD: obtained from NOAA/NESDIS/National Centers for Environmental Information and time aggregated. Original Full Source: NOAA/NESDIS/NCEI/CCOG
- citation :
- Huang et al, 2017: Extended Reconstructed Sea Surface Temperatures Version 5 (ERSSTv5): Upgrades, Validations, and Intercomparisons. Journal of Climate, https://doi.org/10.1175/JCLI-D-16-0836.1
- platform :
- Ship and Buoy SSTs from ICOADS R3.0 and NCEP GTS
- standard_name_vocabulary :
- CF Standard Name Table (v40, 25 January 2017)
- processing_level :
- NOAA Level 4
- Conventions :
- CF-1.6, ACDD-1.3
- metadata_link :
- :metadata_link = https://doi.org/10.7289/V5T72FNM (original format)
- creator_name :
- Boyin Huang (original)
- date_created :
- 2017-06-30T12:18:00Z (original)
- product_version :
- Version 5
- creator_url_original :
- https://www.ncei.noaa.gov
- license :
- No constraints on data access or use
- comment :
- SSTs were observed by conventional thermometers in Buckets (insulated or un-insulated canvas and wooded buckets), Engine Room Intakers, or floats and drifters
- summary :
- ERSST.v5 is developed based on v4 after revisions of 8 parameters using updated data sets and advanced knowledge of ERSST analysis
- dataset_title :
- NOAA Extended Reconstructed SST V5
- data_modified :
- 2020-09-07
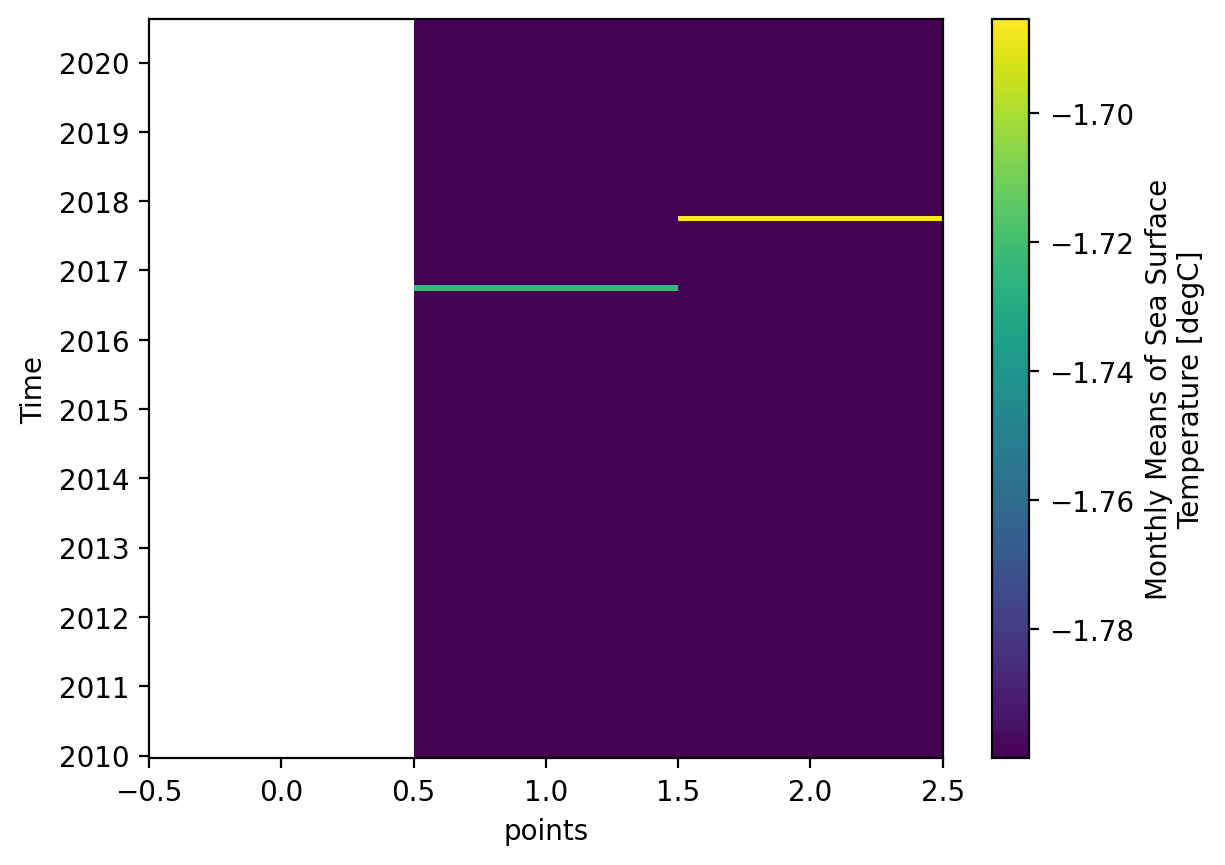
Vectorized Indexing#
Like numpy and pandas, xarray supports indexing many array elements at once in a vectorized manner:
# generate a coordinates for a transect of points
lat_points = xr.DataArray([60, 80, 90], dims="points")
lon_points = xr.DataArray([250, 250, 250], dims="points")
lat_points
<xarray.DataArray (points: 3)> Size: 24B
array([60, 80, 90])
Dimensions without coordinates: points
- points: 3
- 60 80 90
array([60, 80, 90])
<xarray.DataArray (points: 3)> Size: 24B
array([250, 250, 250])
Dimensions without coordinates: points
- points: 3
- 250 250 250
array([250, 250, 250])
# nearest neighbor selection along the transect
da.sel(lat=lat_points, lon=lon_points, method="nearest").plot();
Indexing with where()#
# Let's replace the missing values (nan) with some placeholder
ds.sst.where(ds.sst.notnull(), -99)
Show code cell output
Hide code cell output
<xarray.DataArray 'sst' (time: 128, lat: 89, lon: 180)> Size: 8MB
array([[[ -1.8,  -1.8,  -1.8, ...,  -1.8,  -1.8,  -1.8],
        [ -1.8,  -1.8,  -1.8, ...,  -1.8,  -1.8,  -1.8],
        [ -1.8,  -1.8,  -1.8, ...,  -1.8,  -1.8,  -1.8],
        ...,
        [-99. , -99. , -99. , ..., -99. , -99. , -99. ],
        [-99. , -99. , -99. , ..., -99. , -99. , -99. ],
        [-99. , -99. , -99. , ..., -99. , -99. , -99. ]],

       [[ -1.8,  -1.8,  -1.8, ...,  -1.8,  -1.8,  -1.8],
        [ -1.8,  -1.8,  -1.8, ...,  -1.8,  -1.8,  -1.8],
        [ -1.8,  -1.8,  -1.8, ...,  -1.8,  -1.8,  -1.8],
        ...,
...
        [-99. , -99. , -99. , ..., -99. , -99. , -99. ],
        [-99. , -99. , -99. , ..., -99. , -99. , -99. ],
        [-99. , -99. , -99. , ..., -99. , -99. , -99. ]],

       [[ -1.8,  -1.8,  -1.8, ...,  -1.8,  -1.8,  -1.8],
        [ -1.8,  -1.8,  -1.8, ...,  -1.8,  -1.8,  -1.8],
        [ -1.8,  -1.8,  -1.8, ...,  -1.8,  -1.8,  -1.8],
        ...,
        [-99. , -99. , -99. , ..., -99. , -99. , -99. ],
        [-99. , -99. , -99. , ..., -99. , -99. , -99. ],
        [-99. , -99. , -99. , ..., -99. , -99. , -99. ]]],
      shape=(128, 89, 180), dtype=float32)
Coordinates:
  * lat      (lat) float32 356B 88.0 86.0 84.0 82.0 ... -82.0 -84.0 -86.0 -88.0
  * lon      (lon) float32 720B 0.0 2.0 4.0 6.0 8.0 ... 352.0 354.0 356.0 358.0
  * time     (time) datetime64[ns] 1kB 2010-01-01 2010-02-01 ... 2020-08-01
Attributes:
    long_name:     Monthly Means of Sea Surface Temperature
    units:         degC
    var_desc:      Sea Surface Temperature
    level_desc:    Surface
    statistic:     Mean
    dataset:       NOAA Extended Reconstructed SST V5
    parent_stat:   Individual Values
    actual_range:  [-1.8     42.32636]
valid_range: [-1.8 45. ]- time: 128
- lat: 89
- lon: 180
- -1.8 -1.8 -1.8 -1.8 -1.8 -1.8 ... -99.0 -99.0 -99.0 -99.0 -99.0 -99.0
array([[[ -1.8, -1.8, -1.8, ..., -1.8, -1.8, -1.8], [ -1.8, -1.8, -1.8, ..., -1.8, -1.8, -1.8], [ -1.8, -1.8, -1.8, ..., -1.8, -1.8, -1.8], ..., [-99. , -99. , -99. , ..., -99. , -99. , -99. ], [-99. , -99. , -99. , ..., -99. , -99. , -99. ], [-99. , -99. , -99. , ..., -99. , -99. , -99. ]], [[ -1.8, -1.8, -1.8, ..., -1.8, -1.8, -1.8], [ -1.8, -1.8, -1.8, ..., -1.8, -1.8, -1.8], [ -1.8, -1.8, -1.8, ..., -1.8, -1.8, -1.8], ..., [-99. , -99. , -99. , ..., -99. , -99. , -99. ], [-99. , -99. , -99. , ..., -99. , -99. , -99. ], [-99. , -99. , -99. , ..., -99. , -99. , -99. ]], [[ -1.8, -1.8, -1.8, ..., -1.8, -1.8, -1.8], [ -1.8, -1.8, -1.8, ..., -1.8, -1.8, -1.8], [ -1.8, -1.8, -1.8, ..., -1.8, -1.8, -1.8], ..., ... [-99. , -99. , -99. , ..., -99. , -99. , -99. ], [-99. , -99. , -99. , ..., -99. , -99. , -99. ], [-99. , -99. , -99. , ..., -99. , -99. , -99. ]], [[ -1.8, -1.8, -1.8, ..., -1.8, -1.8, -1.8], [ -1.8, -1.8, -1.8, ..., -1.8, -1.8, -1.8], [ -1.8, -1.8, -1.8, ..., -1.8, -1.8, -1.8], ..., [-99. , -99. , -99. , ..., -99. , -99. , -99. ], [-99. , -99. , -99. , ..., -99. , -99. , -99. ], [-99. , -99. , -99. , ..., -99. , -99. , -99. ]], [[ -1.8, -1.8, -1.8, ..., -1.8, -1.8, -1.8], [ -1.8, -1.8, -1.8, ..., -1.8, -1.8, -1.8], [ -1.8, -1.8, -1.8, ..., -1.8, -1.8, -1.8], ..., [-99. , -99. , -99. , ..., -99. , -99. , -99. ], [-99. , -99. , -99. , ..., -99. , -99. , -99. ], [-99. , -99. , -99. , ..., -99. , -99. , -99. ]]], shape=(128, 89, 180), dtype=float32) - lat(lat)float3288.0 86.0 84.0 ... -86.0 -88.0
- units :
- degrees_north
- long_name :
- Latitude
- actual_range :
- [ 88. -88.]
- standard_name :
- latitude
- axis :
- Y
- coordinate_defines :
- center
array([ 88., 86., 84., 82., 80., 78., 76., 74., 72., 70., 68., 66., 64., 62., 60., 58., 56., 54., 52., 50., 48., 46., 44., 42., 40., 38., 36., 34., 32., 30., 28., 26., 24., 22., 20., 18., 16., 14., 12., 10., 8., 6., 4., 2., 0., -2., -4., -6., -8., -10., -12., -14., -16., -18., -20., -22., -24., -26., -28., -30., -32., -34., -36., -38., -40., -42., -44., -46., -48., -50., -52., -54., -56., -58., -60., -62., -64., -66., -68., -70., -72., -74., -76., -78., -80., -82., -84., -86., -88.], dtype=float32) - lon(lon)float320.0 2.0 4.0 ... 354.0 356.0 358.0
- units :
- degrees_east
- long_name :
- Longitude
- actual_range :
- [ 0. 358.]
- standard_name :
- longitude
- axis :
- X
- coordinate_defines :
- center
array([ 0., 2., 4., 6., 8., 10., 12., 14., 16., 18., 20., 22., 24., 26., 28., 30., 32., 34., 36., 38., 40., 42., 44., 46., 48., 50., 52., 54., 56., 58., 60., 62., 64., 66., 68., 70., 72., 74., 76., 78., 80., 82., 84., 86., 88., 90., 92., 94., 96., 98., 100., 102., 104., 106., 108., 110., 112., 114., 116., 118., 120., 122., 124., 126., 128., 130., 132., 134., 136., 138., 140., 142., 144., 146., 148., 150., 152., 154., 156., 158., 160., 162., 164., 166., 168., 170., 172., 174., 176., 178., 180., 182., 184., 186., 188., 190., 192., 194., 196., 198., 200., 202., 204., 206., 208., 210., 212., 214., 216., 218., 220., 222., 224., 226., 228., 230., 232., 234., 236., 238., 240., 242., 244., 246., 248., 250., 252., 254., 256., 258., 260., 262., 264., 266., 268., 270., 272., 274., 276., 278., 280., 282., 284., 286., 288., 290., 292., 294., 296., 298., 300., 302., 304., 306., 308., 310., 312., 314., 316., 318., 320., 322., 324., 326., 328., 330., 332., 334., 336., 338., 340., 342., 344., 346., 348., 350., 352., 354., 356., 358.], dtype=float32) - time(time)datetime64[ns]2010-01-01 ... 2020-08-01
- long_name :
- Time
- delta_t :
- 0000-01-00 00:00:00
- avg_period :
- 0000-01-00 00:00:00
- prev_avg_period :
- 0000-00-07 00:00:00
- standard_name :
- time
- axis :
- T
- actual_range :
- [19723. 80566.]
array(['2010-01-01T00:00:00.000000000', '2010-02-01T00:00:00.000000000',
       '2010-03-01T00:00:00.000000000', '2010-04-01T00:00:00.000000000',
       '2010-05-01T00:00:00.000000000', '2010-06-01T00:00:00.000000000',
       '2010-07-01T00:00:00.000000000', '2010-08-01T00:00:00.000000000',
       '2010-09-01T00:00:00.000000000', '2010-10-01T00:00:00.000000000',
       '2010-11-01T00:00:00.000000000', '2010-12-01T00:00:00.000000000',
       '2011-01-01T00:00:00.000000000', '2011-02-01T00:00:00.000000000',
       '2011-03-01T00:00:00.000000000', '2011-04-01T00:00:00.000000000',
       '2011-05-01T00:00:00.000000000', '2011-06-01T00:00:00.000000000',
       '2011-07-01T00:00:00.000000000', '2011-08-01T00:00:00.000000000',
       '2011-09-01T00:00:00.000000000', '2011-10-01T00:00:00.000000000',
       '2011-11-01T00:00:00.000000000', '2011-12-01T00:00:00.000000000',
       '2012-01-01T00:00:00.000000000', '2012-02-01T00:00:00.000000000',
       '2012-03-01T00:00:00.000000000', '2012-04-01T00:00:00.000000000',
       '2012-05-01T00:00:00.000000000', '2012-06-01T00:00:00.000000000',
       '2012-07-01T00:00:00.000000000', '2012-08-01T00:00:00.000000000',
       '2012-09-01T00:00:00.000000000', '2012-10-01T00:00:00.000000000',
       '2012-11-01T00:00:00.000000000', '2012-12-01T00:00:00.000000000',
       '2013-01-01T00:00:00.000000000', '2013-02-01T00:00:00.000000000',
       '2013-03-01T00:00:00.000000000', '2013-04-01T00:00:00.000000000',
       '2013-05-01T00:00:00.000000000', '2013-06-01T00:00:00.000000000',
       '2013-07-01T00:00:00.000000000', '2013-08-01T00:00:00.000000000',
       '2013-09-01T00:00:00.000000000', '2013-10-01T00:00:00.000000000',
       '2013-11-01T00:00:00.000000000', '2013-12-01T00:00:00.000000000',
       '2014-01-01T00:00:00.000000000', '2014-02-01T00:00:00.000000000',
       '2014-03-01T00:00:00.000000000', '2014-04-01T00:00:00.000000000',
       '2014-05-01T00:00:00.000000000', '2014-06-01T00:00:00.000000000',
       '2014-07-01T00:00:00.000000000', '2014-08-01T00:00:00.000000000',
       '2014-09-01T00:00:00.000000000', '2014-10-01T00:00:00.000000000',
       '2014-11-01T00:00:00.000000000', '2014-12-01T00:00:00.000000000',
       '2015-01-01T00:00:00.000000000', '2015-02-01T00:00:00.000000000',
       '2015-03-01T00:00:00.000000000', '2015-04-01T00:00:00.000000000',
       '2015-05-01T00:00:00.000000000', '2015-06-01T00:00:00.000000000',
       '2015-07-01T00:00:00.000000000', '2015-08-01T00:00:00.000000000',
       '2015-09-01T00:00:00.000000000', '2015-10-01T00:00:00.000000000',
       '2015-11-01T00:00:00.000000000', '2015-12-01T00:00:00.000000000',
       '2016-01-01T00:00:00.000000000', '2016-02-01T00:00:00.000000000',
       '2016-03-01T00:00:00.000000000', '2016-04-01T00:00:00.000000000',
       '2016-05-01T00:00:00.000000000', '2016-06-01T00:00:00.000000000',
       '2016-07-01T00:00:00.000000000', '2016-08-01T00:00:00.000000000',
       '2016-09-01T00:00:00.000000000', '2016-10-01T00:00:00.000000000',
       '2016-11-01T00:00:00.000000000', '2016-12-01T00:00:00.000000000',
       '2017-01-01T00:00:00.000000000', '2017-02-01T00:00:00.000000000',
       '2017-03-01T00:00:00.000000000', '2017-04-01T00:00:00.000000000',
       '2017-05-01T00:00:00.000000000', '2017-06-01T00:00:00.000000000',
       '2017-07-01T00:00:00.000000000', '2017-08-01T00:00:00.000000000',
       '2017-09-01T00:00:00.000000000', '2017-10-01T00:00:00.000000000',
       '2017-11-01T00:00:00.000000000', '2017-12-01T00:00:00.000000000',
       '2018-01-01T00:00:00.000000000', '2018-02-01T00:00:00.000000000',
       '2018-03-01T00:00:00.000000000', '2018-04-01T00:00:00.000000000',
       '2018-05-01T00:00:00.000000000', '2018-06-01T00:00:00.000000000',
       '2018-07-01T00:00:00.000000000', '2018-08-01T00:00:00.000000000',
       '2018-09-01T00:00:00.000000000', '2018-10-01T00:00:00.000000000',
       '2018-11-01T00:00:00.000000000', '2018-12-01T00:00:00.000000000',
       '2019-01-01T00:00:00.000000000', '2019-02-01T00:00:00.000000000',
       '2019-03-01T00:00:00.000000000', '2019-04-01T00:00:00.000000000',
       '2019-05-01T00:00:00.000000000', '2019-06-01T00:00:00.000000000',
       '2019-07-01T00:00:00.000000000', '2019-08-01T00:00:00.000000000',
       '2019-09-01T00:00:00.000000000', '2019-10-01T00:00:00.000000000',
       '2019-11-01T00:00:00.000000000', '2019-12-01T00:00:00.000000000',
       '2020-01-01T00:00:00.000000000', '2020-02-01T00:00:00.000000000',
       '2020-03-01T00:00:00.000000000', '2020-04-01T00:00:00.000000000',
       '2020-05-01T00:00:00.000000000', '2020-06-01T00:00:00.000000000',
       '2020-07-01T00:00:00.000000000', '2020-08-01T00:00:00.000000000'],
      dtype='datetime64[ns]')
- latPandasIndex
PandasIndex(Index([ 88.0, 86.0, 84.0, 82.0, 80.0, 78.0, 76.0, 74.0, 72.0, 70.0, 68.0, 66.0, 64.0, 62.0, 60.0, 58.0, 56.0, 54.0, 52.0, 50.0, 48.0, 46.0, 44.0, 42.0, 40.0, 38.0, 36.0, 34.0, 32.0, 30.0, 28.0, 26.0, 24.0, 22.0, 20.0, 18.0, 16.0, 14.0, 12.0, 10.0, 8.0, 6.0, 4.0, 2.0, 0.0, -2.0, -4.0, -6.0, -8.0, -10.0, -12.0, -14.0, -16.0, -18.0, -20.0, -22.0, -24.0, -26.0, -28.0, -30.0, -32.0, -34.0, -36.0, -38.0, -40.0, -42.0, -44.0, -46.0, -48.0, -50.0, -52.0, -54.0, -56.0, -58.0, -60.0, -62.0, -64.0, -66.0, -68.0, -70.0, -72.0, -74.0, -76.0, -78.0, -80.0, -82.0, -84.0, -86.0, -88.0], dtype='float32', name='lat')) - lonPandasIndex
PandasIndex(Index([ 0.0, 2.0, 4.0, 6.0, 8.0, 10.0, 12.0, 14.0, 16.0, 18.0, ... 340.0, 342.0, 344.0, 346.0, 348.0, 350.0, 352.0, 354.0, 356.0, 358.0], dtype='float32', name='lon', length=180)) - timePandasIndex
PandasIndex(DatetimeIndex(['2010-01-01', '2010-02-01', '2010-03-01', '2010-04-01',
               '2010-05-01', '2010-06-01', '2010-07-01', '2010-08-01',
               '2010-09-01', '2010-10-01',
               ...
               '2019-11-01', '2019-12-01', '2020-01-01', '2020-02-01',
               '2020-03-01', '2020-04-01', '2020-05-01', '2020-06-01',
               '2020-07-01', '2020-08-01'],
              dtype='datetime64[ns]', name='time', length=128, freq=None))
- long_name :
- Monthly Means of Sea Surface Temperature
- units :
- degC
- var_desc :
- Sea Surface Temperature
- level_desc :
- Surface
- statistic :
- Mean
- dataset :
- NOAA Extended Reconstructed SST V5
- parent_stat :
- Individual Values
- actual_range :
- [-1.8 42.32636]
- valid_range :
- [-1.8 45. ]
Going Further#
Previous: xarray fundamentals
Next: Computation