Data Structures#
Multi-dimensional (a.k.a. N-dimensional, ND) arrays (sometimes called “tensors”) are an essential part of computational science. They are encountered in a wide range of fields, including physics, astronomy, geoscience, bioinformatics, engineering, finance, and deep learning. In Python, NumPy provides the fundamental data structure and API for working with raw ND arrays. However, real-world datasets are usually more than just raw numbers; they have labels which encode information about how the array values map to locations in space, time, etc.
The N-dimensional nature of Xarray’s data structures makes it suitable for
dealing with multi-dimensional scientific data, and its use of dimension names
instead of axis labels (dim='time' instead of axis=0) makes such arrays much
more manageable than the raw NumPy ndarray: with Xarray, you don’t need to keep
track of the order of an array’s dimensions or insert dummy dimensions of size 1
to align arrays (e.g., using np.newaxis).
The immediate payoff of using Xarray is that you’ll write less code. The long-term payoff is that you’ll understand what you were thinking when you come back to look at it weeks or months later.
Example: Weather forecast#
Here is an example of how we might structure a dataset for a weather forecast:

You’ll notice multiple data variables (temperature, precipitation), coordinate variables (latitude, longitude), and dimensions (x, y, t). We’ll cover how these fit into Xarray’s data structures below.
Xarray doesn’t just keep track of labels on arrays – it uses them to provide a powerful and concise interface. For example:
Apply operations over dimensions by name:
x.sum('time').Select values by label (or logical location) instead of integer location:
x.loc['2014-01-01']orx.sel(time='2014-01-01').Mathematical operations (e.g.,
x - y) vectorize across multiple dimensions (array broadcasting) based on dimension names, not shape.Easily use the split-apply-combine paradigm with groupby:
x.groupby('time.dayofyear').mean().Database-like alignment based on coordinate labels that smoothly handles missing values:
x, y = xr.align(x, y, join='outer').Keep track of arbitrary metadata in the form of a Python dictionary:
x.attrs.
Example: Mosquito genetics#
Although the Xarray library was originally developed with Earth Science datasets in mind, the datastructures work well across many other domains! For example, below is a side-by-side view of a data schematic on the left and Xarray Dataset representation on the right taken from a mosquito genetics analysis:
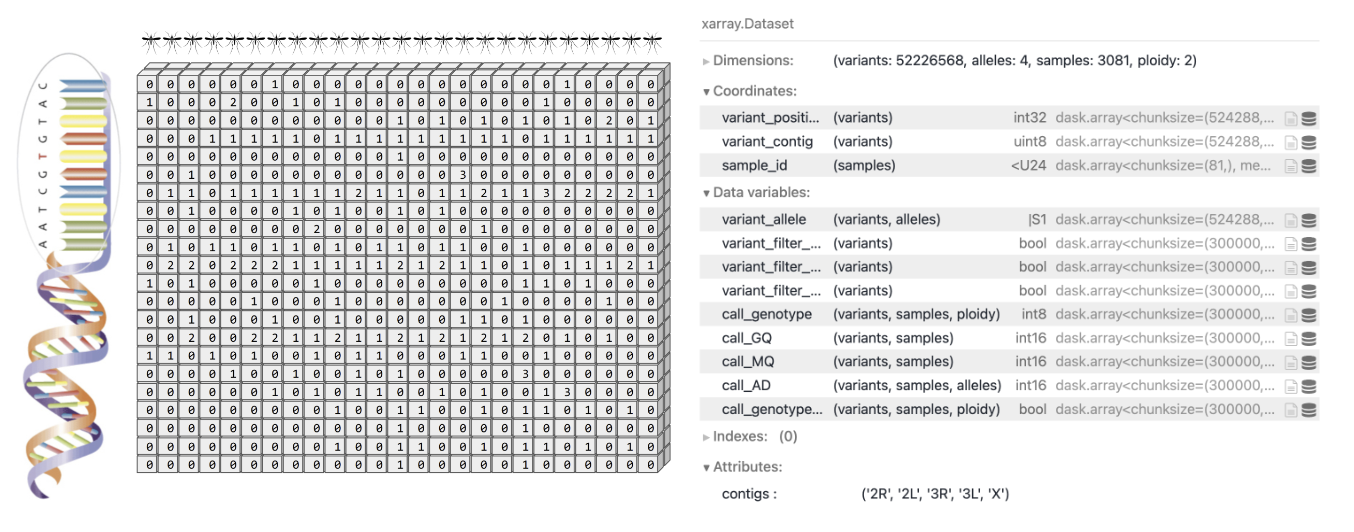
The data can be stored as a 3-dimensional array, where one dimension of the array corresponds to positions (variants) within a reference genome, another dimension corresponds to the individual mosquitoes that were sequenced (samples), and a third dimension corresponds to the number of genomes within each individual (ploidy).”
You can explore this dataset in detail via the training course in data analysis for genomic surveillance of African malaria vectors!
Explore on your own#
The following collection of notebooks provide interactive code examples for working with example datasets and constructing Xarray data structures manually.