Intermediate Xarray DataStructures#
In this lesson, we cover the basics of Xarray data structures. By the end of the lesson, we will be able to:
Understand the basic data structures in Xarray
Inspect
DataArrayandDatasetobjects.Select Data using Dataset Coordinates
Understand that these Datastructures generalize across fields
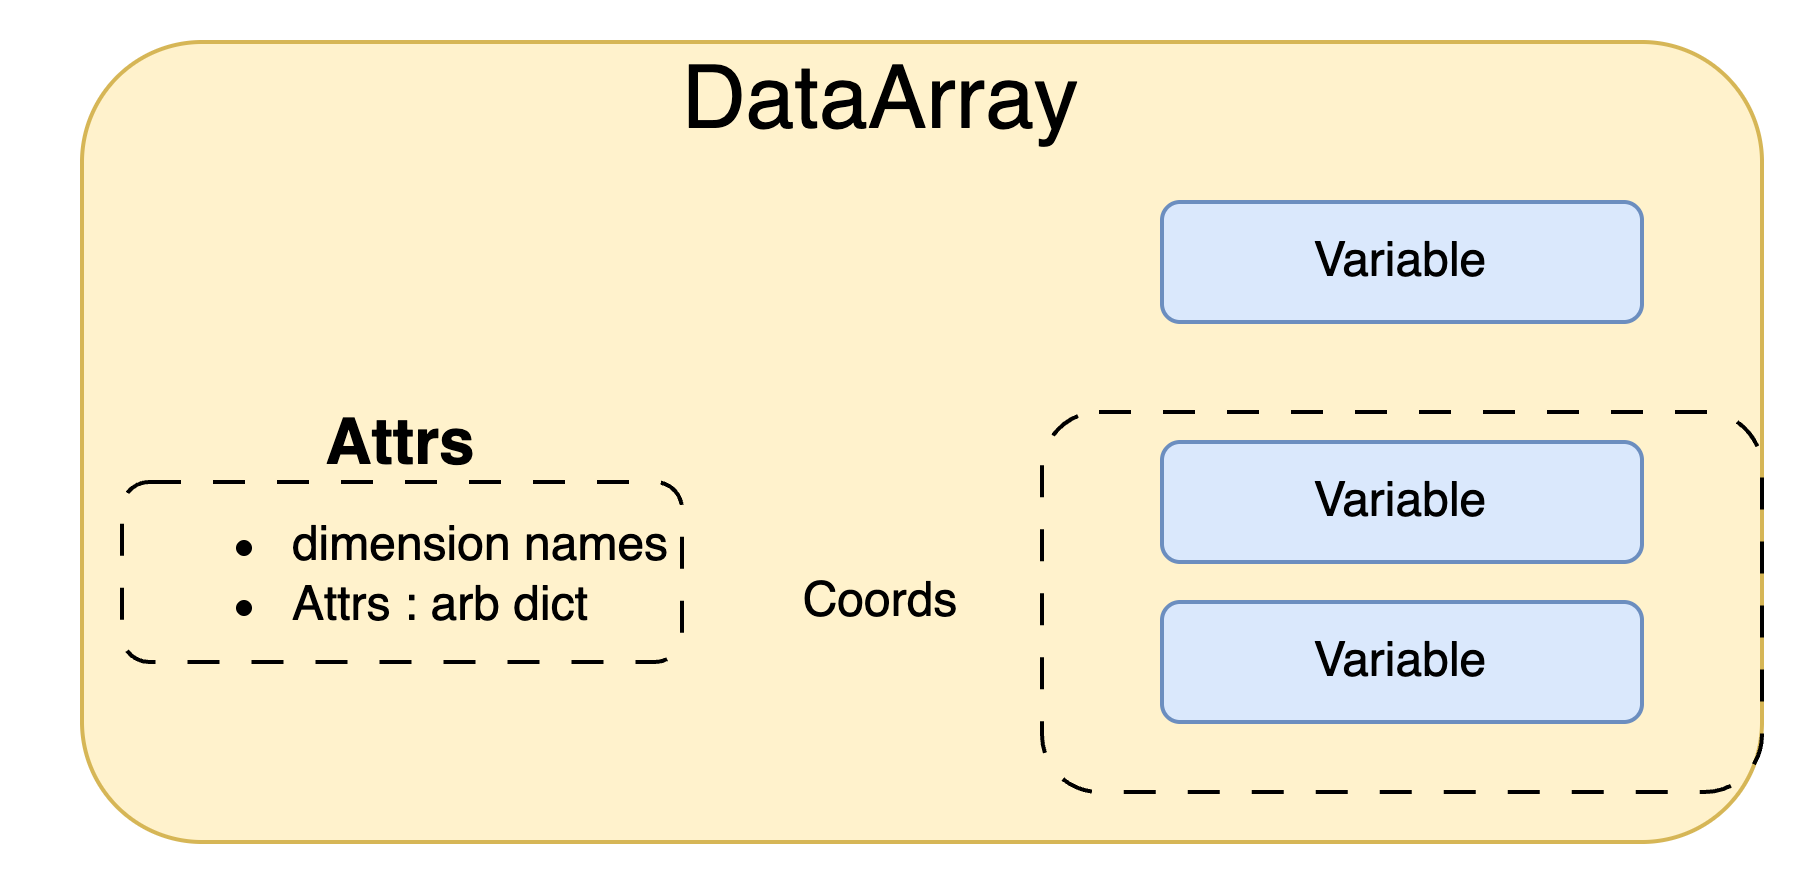
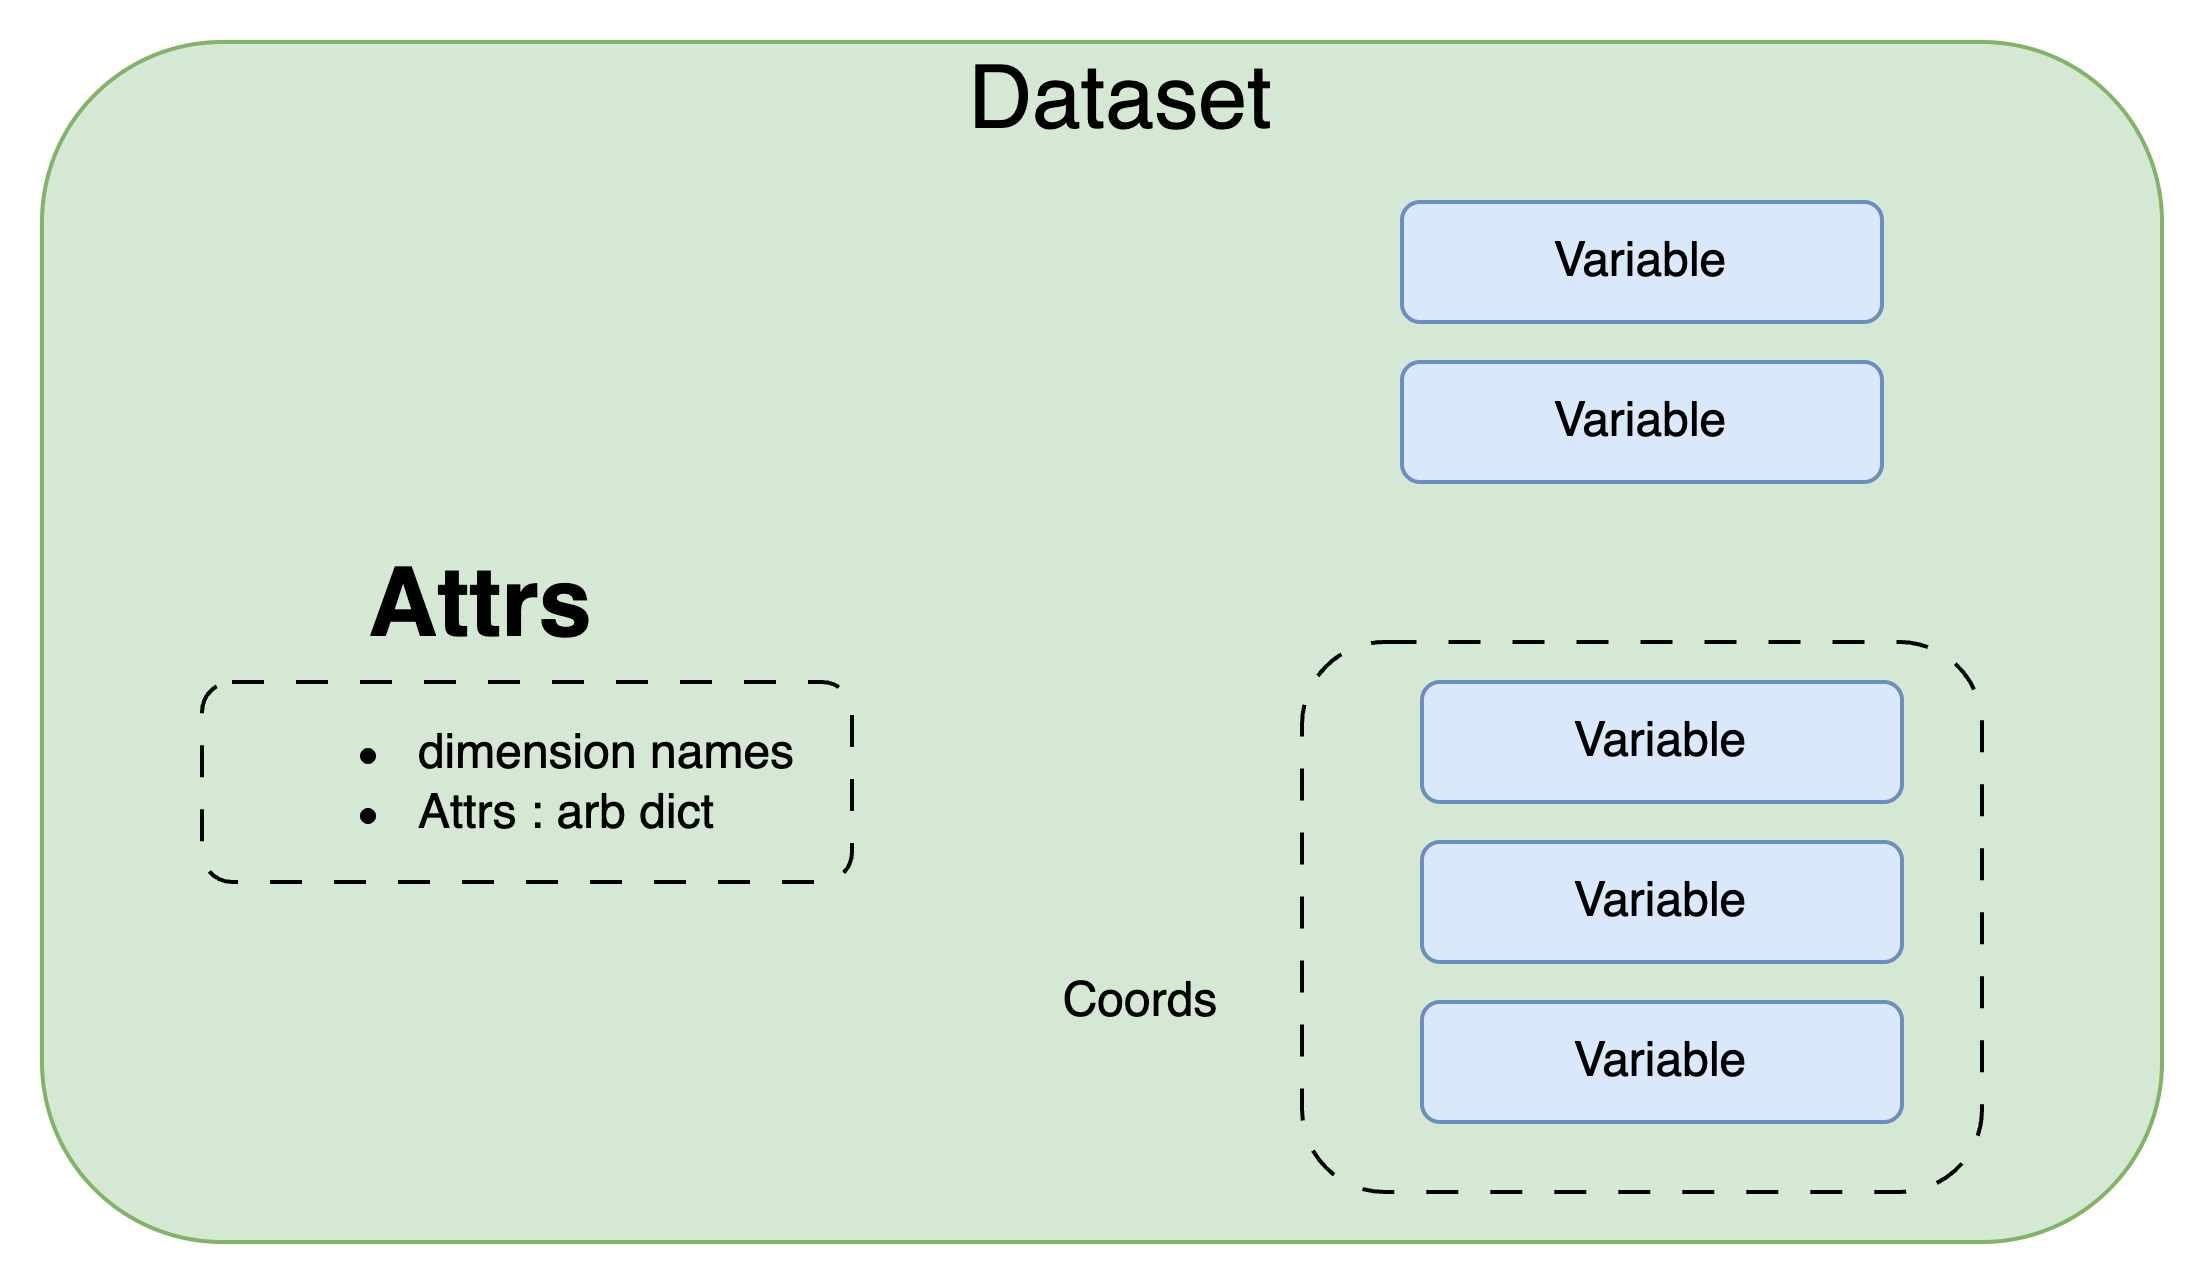
We’ll start by reviewing the various components of the Xarray data model, represented here visually:

Variable#
At the the core of everything Xarray works with Variables:
Variables hold arbitrary metadata, dimension names, and an Array of data

DataArray#
A DataArray is lowest level object you will regularly interact with. It is a collection of 1 variable containing the data, and optionally Variables associated with the dimensions (coords)
Dataset#
A Dataset is also a collection of Variables. However it can contain multiple data variables. All dimensions MUST be compatible. When we access one of the data variables a DataArray will automatically created for us.
import matplotlib.pyplot as plt
import numpy as np
import xarray as xr
Xarray has a few small real-world tutorial datasets hosted in the xarray-data GitHub repository.
xarray.tutorial.load_dataset is a convenience function to download and open DataSets by name (listed at that link).
Here we’ll use air temperature from the National Center for Environmental Prediction. Xarray objects have convenient HTML representations to give an overview of what we’re working with:
ds = xr.tutorial.load_dataset("air_temperature")
ds
<xarray.Dataset> Size: 31MB
Dimensions:  (time: 2920, lat: 25, lon: 53)
Coordinates:
  * time     (time) datetime64[ns] 23kB 2013-01-01 ... 2014-12-31T18:00:00
  * lat      (lat) float32 100B 75.0 72.5 70.0 67.5 65.0 ... 22.5 20.0 17.5 15.0
  * lon      (lon) float32 212B 200.0 202.5 205.0 207.5 ... 325.0 327.5 330.0
Data variables:
    air      (time, lat, lon) float64 31MB 241.2 242.5 243.5 ... 296.2 295.7
Attributes:
    Conventions:  COARDS
    title:        4x daily NMC reanalysis (1948)
    description:  Data is from NMC initialized reanalysis\n(4x/day).  These a...
    platform:     Model
references: http://www.esrl.noaa.gov/psd/data/gridded/data.ncep.reanaly...Note that behind the scenes the tutorial.open_dataset downloads a file. It then uses xarray.open_dataset function to open that file (which for this datasets is a netCDF file).
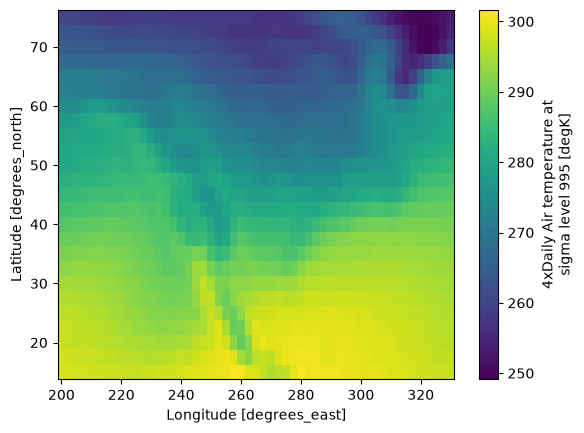
As a preview of the power of Xarray, using this data structure allows us to make very readable and powerful statements such as:
ds.air.mean(dim="time").plot(x="lon")
<matplotlib.collections.QuadMesh at 0x7f09c32f1160>
What’s in a Dataset?#
Many DataArrays!
Datasets are dictionary-like containers of “DataArray”s. They are a mapping of variable name to DataArray:
# pull out "air" dataarray with dictionary syntax
ds["air"]
<xarray.DataArray 'air' (time: 2920, lat: 25, lon: 53)> Size: 31MB
array([[[241.2 , 242.5 , 243.5 , ..., 232.8 , 235.5 , 238.6 ],
[243.8 , 244.5 , 244.7 , ..., 232.8 , 235.3 , 239.3 ],
[250. , 249.8 , 248.89, ..., 233.2 , 236.39, 241.7 ],
...,
[296.6 , 296.2 , 296.4 , ..., 295.4 , 295.1 , 294.7 ],
[295.9 , 296.2 , 296.79, ..., 295.9 , 295.9 , 295.2 ],
[296.29, 296.79, 297.1 , ..., 296.9 , 296.79, 296.6 ]],
[[242.1 , 242.7 , 243.1 , ..., 232. , 233.6 , 235.8 ],
[243.6 , 244.1 , 244.2 , ..., 231. , 232.5 , 235.7 ],
[253.2 , 252.89, 252.1 , ..., 230.8 , 233.39, 238.5 ],
...,
[296.4 , 295.9 , 296.2 , ..., 295.4 , 295.1 , 294.79],
[296.2 , 296.7 , 296.79, ..., 295.6 , 295.5 , 295.1 ],
[296.29, 297.2 , 297.4 , ..., 296.4 , 296.4 , 296.6 ]],
[[242.3 , 242.2 , 242.3 , ..., 234.3 , 236.1 , 238.7 ],
[244.6 , 244.39, 244. , ..., 230.3 , 232. , 235.7 ],
[256.2 , 255.5 , 254.2 , ..., 231.2 , 233.2 , 238.2 ],
...,
...
[294.79, 295.29, 297.49, ..., 295.49, 295.39, 294.69],
[296.79, 297.89, 298.29, ..., 295.49, 295.49, 294.79],
[298.19, 299.19, 298.79, ..., 296.09, 295.79, 295.79]],
[[245.79, 244.79, 243.49, ..., 243.29, 243.99, 244.79],
[249.89, 249.29, 248.49, ..., 241.29, 242.49, 244.29],
[262.39, 261.79, 261.29, ..., 240.49, 243.09, 246.89],
...,
[293.69, 293.89, 295.39, ..., 295.09, 294.69, 294.29],
[296.29, 297.19, 297.59, ..., 295.29, 295.09, 294.39],
[297.79, 298.39, 298.49, ..., 295.69, 295.49, 295.19]],
[[245.09, 244.29, 243.29, ..., 241.69, 241.49, 241.79],
[249.89, 249.29, 248.39, ..., 239.59, 240.29, 241.69],
[262.99, 262.19, 261.39, ..., 239.89, 242.59, 246.29],
...,
[293.79, 293.69, 295.09, ..., 295.29, 295.09, 294.69],
[296.09, 296.89, 297.19, ..., 295.69, 295.69, 295.19],
[297.69, 298.09, 298.09, ..., 296.49, 296.19, 295.69]]],
shape=(2920, 25, 53))
Coordinates:
* time (time) datetime64[ns] 23kB 2013-01-01 ... 2014-12-31T18:00:00
* lat (lat) float32 100B 75.0 72.5 70.0 67.5 65.0 ... 22.5 20.0 17.5 15.0
* lon (lon) float32 212B 200.0 202.5 205.0 207.5 ... 325.0 327.5 330.0
Attributes:
long_name: 4xDaily Air temperature at sigma level 995
units: degK
precision: 2
GRIB_id: 11
GRIB_name: TMP
var_desc: Air temperature
dataset: NMC Reanalysis
level_desc: Surface
statistic: Individual Obs
parent_stat: Other
actual_range: [185.16 322.1 ]You can save some typing by using the “attribute” or “dot” notation. This won’t
work for variable names that clash with a built-in method name (like mean for
example).
# pull out dataarray using dot notation
ds.air
<xarray.DataArray 'air' (time: 2920, lat: 25, lon: 53)> Size: 31MB
array([[[241.2 , 242.5 , 243.5 , ..., 232.8 , 235.5 , 238.6 ],
[243.8 , 244.5 , 244.7 , ..., 232.8 , 235.3 , 239.3 ],
[250. , 249.8 , 248.89, ..., 233.2 , 236.39, 241.7 ],
...,
[296.6 , 296.2 , 296.4 , ..., 295.4 , 295.1 , 294.7 ],
[295.9 , 296.2 , 296.79, ..., 295.9 , 295.9 , 295.2 ],
[296.29, 296.79, 297.1 , ..., 296.9 , 296.79, 296.6 ]],
[[242.1 , 242.7 , 243.1 , ..., 232. , 233.6 , 235.8 ],
[243.6 , 244.1 , 244.2 , ..., 231. , 232.5 , 235.7 ],
[253.2 , 252.89, 252.1 , ..., 230.8 , 233.39, 238.5 ],
...,
[296.4 , 295.9 , 296.2 , ..., 295.4 , 295.1 , 294.79],
[296.2 , 296.7 , 296.79, ..., 295.6 , 295.5 , 295.1 ],
[296.29, 297.2 , 297.4 , ..., 296.4 , 296.4 , 296.6 ]],
[[242.3 , 242.2 , 242.3 , ..., 234.3 , 236.1 , 238.7 ],
[244.6 , 244.39, 244. , ..., 230.3 , 232. , 235.7 ],
[256.2 , 255.5 , 254.2 , ..., 231.2 , 233.2 , 238.2 ],
...,
...
[294.79, 295.29, 297.49, ..., 295.49, 295.39, 294.69],
[296.79, 297.89, 298.29, ..., 295.49, 295.49, 294.79],
[298.19, 299.19, 298.79, ..., 296.09, 295.79, 295.79]],
[[245.79, 244.79, 243.49, ..., 243.29, 243.99, 244.79],
[249.89, 249.29, 248.49, ..., 241.29, 242.49, 244.29],
[262.39, 261.79, 261.29, ..., 240.49, 243.09, 246.89],
...,
[293.69, 293.89, 295.39, ..., 295.09, 294.69, 294.29],
[296.29, 297.19, 297.59, ..., 295.29, 295.09, 294.39],
[297.79, 298.39, 298.49, ..., 295.69, 295.49, 295.19]],
[[245.09, 244.29, 243.29, ..., 241.69, 241.49, 241.79],
[249.89, 249.29, 248.39, ..., 239.59, 240.29, 241.69],
[262.99, 262.19, 261.39, ..., 239.89, 242.59, 246.29],
...,
[293.79, 293.69, 295.09, ..., 295.29, 295.09, 294.69],
[296.09, 296.89, 297.19, ..., 295.69, 295.69, 295.19],
[297.69, 298.09, 298.09, ..., 296.49, 296.19, 295.69]]],
shape=(2920, 25, 53))
Coordinates:
* time (time) datetime64[ns] 23kB 2013-01-01 ... 2014-12-31T18:00:00
* lat (lat) float32 100B 75.0 72.5 70.0 67.5 65.0 ... 22.5 20.0 17.5 15.0
* lon (lon) float32 212B 200.0 202.5 205.0 207.5 ... 325.0 327.5 330.0
Attributes:
long_name: 4xDaily Air temperature at sigma level 995
units: degK
precision: 2
GRIB_id: 11
GRIB_name: TMP
var_desc: Air temperature
dataset: NMC Reanalysis
level_desc: Surface
statistic: Individual Obs
parent_stat: Other
actual_range: [185.16 322.1 ]What’s in a DataArray?#
data + (a lot of) metadata
Name (optional)#
da = ds.air
da.name
'air'
Named dimensions#
.dims correspond to the axes of your data.
In this case we have 2 spatial dimensions (latitude and longitude are stored with shorthand names lat and lon) and one temporal dimension (time).
da.dims
('time', 'lat', 'lon')
Coordinate variables#
.coords is a simple data container
for coordinate variables.
Here we see the actual timestamps and spatial positions of our air temperature data:
da.coords
Coordinates:
* time (time) datetime64[ns] 23kB 2013-01-01 ... 2014-12-31T18:00:00
* lat (lat) float32 100B 75.0 72.5 70.0 67.5 65.0 ... 22.5 20.0 17.5 15.0
* lon (lon) float32 212B 200.0 202.5 205.0 207.5 ... 325.0 327.5 330.0
Coordinates objects support similar indexing notation
# extracting coordinate variables
da.lon
<xarray.DataArray 'lon' (lon: 53)> Size: 212B
array([200. , 202.5, 205. , 207.5, 210. , 212.5, 215. , 217.5, 220. , 222.5,
       225. , 227.5, 230. , 232.5, 235. , 237.5, 240. , 242.5, 245. , 247.5,
       250. , 252.5, 255. , 257.5, 260. , 262.5, 265. , 267.5, 270. , 272.5,
       275. , 277.5, 280. , 282.5, 285. , 287.5, 290. , 292.5, 295. , 297.5,
       300. , 302.5, 305. , 307.5, 310. , 312.5, 315. , 317.5, 320. , 322.5,
       325. , 327.5, 330. ], dtype=float32)
Coordinates:
* lon (lon) float32 212B 200.0 202.5 205.0 207.5 ... 325.0 327.5 330.0
Attributes:
standard_name: longitude
long_name: Longitude
units: degrees_east
axis: X# extracting coordinate variables from .coords
da.coords["lon"]
<xarray.DataArray 'lon' (lon: 53)> Size: 212B
array([200. , 202.5, 205. , 207.5, 210. , 212.5, 215. , 217.5, 220. , 222.5,
225. , 227.5, 230. , 232.5, 235. , 237.5, 240. , 242.5, 245. , 247.5,
250. , 252.5, 255. , 257.5, 260. , 262.5, 265. , 267.5, 270. , 272.5,
275. , 277.5, 280. , 282.5, 285. , 287.5, 290. , 292.5, 295. , 297.5,
300. , 302.5, 305. , 307.5, 310. , 312.5, 315. , 317.5, 320. , 322.5,
325. , 327.5, 330. ], dtype=float32)
Coordinates:
* lon (lon) float32 212B 200.0 202.5 205.0 207.5 ... 325.0 327.5 330.0
Attributes:
standard_name: longitude
long_name: Longitude
units: degrees_east
axis: XIt is useful to think of the values in these coordinate variables as axis “labels” such as “tick labels” in a figure. These are coordinate locations on a grid at which you have data.
Arbitrary attributes#
.attrs is a dictionary that can contain arbitrary Python objects (strings, lists, integers, dictionaries, etc.) Your only
limitation is that some attributes may not be writeable to certain file formats.
da.attrs
{'long_name': '4xDaily Air temperature at sigma level 995',
'units': 'degK',
'precision': np.int16(2),
'GRIB_id': np.int16(11),
'GRIB_name': 'TMP',
'var_desc': 'Air temperature',
'dataset': 'NMC Reanalysis',
'level_desc': 'Surface',
'statistic': 'Individual Obs',
'parent_stat': 'Other',
'actual_range': array([185.16, 322.1 ], dtype=float32)}
# assign your own attributes!
da.attrs["who_is_awesome"] = "xarray"
da.attrs
{'long_name': '4xDaily Air temperature at sigma level 995',
'units': 'degK',
'precision': np.int16(2),
'GRIB_id': np.int16(11),
'GRIB_name': 'TMP',
'var_desc': 'Air temperature',
'dataset': 'NMC Reanalysis',
'level_desc': 'Surface',
'statistic': 'Individual Obs',
'parent_stat': 'Other',
'actual_range': array([185.16, 322.1 ], dtype=float32),
'who_is_awesome': 'xarray'}
da
<xarray.DataArray 'air' (time: 2920, lat: 25, lon: 53)> Size: 31MB
array([[[241.2 , 242.5 , 243.5 , ..., 232.8 , 235.5 , 238.6 ],
        [243.8 , 244.5 , 244.7 , ..., 232.8 , 235.3 , 239.3 ],
        [250.  , 249.8 , 248.89, ..., 233.2 , 236.39, 241.7 ],
        ...,
        [296.6 , 296.2 , 296.4 , ..., 295.4 , 295.1 , 294.7 ],
        [295.9 , 296.2 , 296.79, ..., 295.9 , 295.9 , 295.2 ],
        [296.29, 296.79, 297.1 , ..., 296.9 , 296.79, 296.6 ]],

       [[242.1 , 242.7 , 243.1 , ..., 232.  , 233.6 , 235.8 ],
        [243.6 , 244.1 , 244.2 , ..., 231.  , 232.5 , 235.7 ],
        [253.2 , 252.89, 252.1 , ..., 230.8 , 233.39, 238.5 ],
        ...,
        [296.4 , 295.9 , 296.2 , ..., 295.4 , 295.1 , 294.79],
        [296.2 , 296.7 , 296.79, ..., 295.6 , 295.5 , 295.1 ],
        [296.29, 297.2 , 297.4 , ..., 296.4 , 296.4 , 296.6 ]],

       [[242.3 , 242.2 , 242.3 , ..., 234.3 , 236.1 , 238.7 ],
        [244.6 , 244.39, 244.  , ..., 230.3 , 232.  , 235.7 ],
        [256.2 , 255.5 , 254.2 , ..., 231.2 , 233.2 , 238.2 ],
        ...,
...
        [294.79, 295.29, 297.49, ..., 295.49, 295.39, 294.69],
        [296.79, 297.89, 298.29, ..., 295.49, 295.49, 294.79],
        [298.19, 299.19, 298.79, ..., 296.09, 295.79, 295.79]],

       [[245.79, 244.79, 243.49, ..., 243.29, 243.99, 244.79],
        [249.89, 249.29, 248.49, ..., 241.29, 242.49, 244.29],
        [262.39, 261.79, 261.29, ..., 240.49, 243.09, 246.89],
        ...,
        [293.69, 293.89, 295.39, ..., 295.09, 294.69, 294.29],
        [296.29, 297.19, 297.59, ..., 295.29, 295.09, 294.39],
        [297.79, 298.39, 298.49, ..., 295.69, 295.49, 295.19]],

       [[245.09, 244.29, 243.29, ..., 241.69, 241.49, 241.79],
        [249.89, 249.29, 248.39, ..., 239.59, 240.29, 241.69],
        [262.99, 262.19, 261.39, ..., 239.89, 242.59, 246.29],
        ...,
        [293.79, 293.69, 295.09, ..., 295.29, 295.09, 294.69],
        [296.09, 296.89, 297.19, ..., 295.69, 295.69, 295.19],
        [297.69, 298.09, 298.09, ..., 296.49, 296.19, 295.69]]],
      shape=(2920, 25, 53))
Coordinates:
  * time     (time) datetime64[ns] 23kB 2013-01-01 ... 2014-12-31T18:00:00
  * lat      (lat) float32 100B 75.0 72.5 70.0 67.5 65.0 ... 22.5 20.0 17.5 15.0
  * lon      (lon) float32 212B 200.0 202.5 205.0 207.5 ... 325.0 327.5 330.0
Attributes:
long_name: 4xDaily Air temperature at sigma level 995
units: degK
precision: 2
GRIB_id: 11
GRIB_name: TMP
var_desc: Air temperature
dataset: NMC Reanalysis
level_desc: Surface
statistic: Individual Obs
parent_stat: Other
actual_range: [185.16 322.1 ]
who_is_awesome: xarrayUnderlying data#
.data contains the numpy array storing air temperature values.
Xarray structures wrap underlying simpler array-like data structures. This part of Xarray is quite extensible allowing for distributed array, GPU arrays, sparse arrays, arrays with units etc. We’ll briefly look at this later in this tutorial.
da.data
array([[[241.2 , 242.5 , 243.5 , ..., 232.8 , 235.5 , 238.6 ],
        [243.8 , 244.5 , 244.7 , ..., 232.8 , 235.3 , 239.3 ],
        [250.  , 249.8 , 248.89, ..., 233.2 , 236.39, 241.7 ],
        ...,
        [296.6 , 296.2 , 296.4 , ..., 295.4 , 295.1 , 294.7 ],
        [295.9 , 296.2 , 296.79, ..., 295.9 , 295.9 , 295.2 ],
        [296.29, 296.79, 297.1 , ..., 296.9 , 296.79, 296.6 ]],

       [[242.1 , 242.7 , 243.1 , ..., 232.  , 233.6 , 235.8 ],
        [243.6 , 244.1 , 244.2 , ..., 231.  , 232.5 , 235.7 ],
        [253.2 , 252.89, 252.1 , ..., 230.8 , 233.39, 238.5 ],
        ...,
        [296.4 , 295.9 , 296.2 , ..., 295.4 , 295.1 , 294.79],
        [296.2 , 296.7 , 296.79, ..., 295.6 , 295.5 , 295.1 ],
        [296.29, 297.2 , 297.4 , ..., 296.4 , 296.4 , 296.6 ]],

       [[242.3 , 242.2 , 242.3 , ..., 234.3 , 236.1 , 238.7 ],
        [244.6 , 244.39, 244.  , ..., 230.3 , 232.  , 235.7 ],
        [256.2 , 255.5 , 254.2 , ..., 231.2 , 233.2 , 238.2 ],
        ...,
        [295.6 , 295.4 , 295.4 , ..., 296.29, 295.29, 295.  ],
        [296.2 , 296.5 , 296.29, ..., 296.4 , 296.  , 295.6 ],
        [296.4 , 296.29, 296.4 , ..., 297.  , 297.  , 296.79]],

       ...,

       [[243.49, 242.99, 242.09, ..., 244.19, 244.49, 244.89],
        [249.09, 248.99, 248.59, ..., 240.59, 241.29, 242.69],
        [262.69, 262.19, 261.69, ..., 239.39, 241.69, 245.19],
        ...,
        [294.79, 295.29, 297.49, ..., 295.49, 295.39, 294.69],
        [296.79, 297.89, 298.29, ..., 295.49, 295.49, 294.79],
        [298.19, 299.19, 298.79, ..., 296.09, 295.79, 295.79]],

       [[245.79, 244.79, 243.49, ..., 243.29, 243.99, 244.79],
        [249.89, 249.29, 248.49, ..., 241.29, 242.49, 244.29],
        [262.39, 261.79, 261.29, ..., 240.49, 243.09, 246.89],
        ...,
        [293.69, 293.89, 295.39, ..., 295.09, 294.69, 294.29],
        [296.29, 297.19, 297.59, ..., 295.29, 295.09, 294.39],
        [297.79, 298.39, 298.49, ..., 295.69, 295.49, 295.19]],

       [[245.09, 244.29, 243.29, ..., 241.69, 241.49, 241.79],
        [249.89, 249.29, 248.39, ..., 239.59, 240.29, 241.69],
        [262.99, 262.19, 261.39, ..., 239.89, 242.59, 246.29],
        ...,
        [293.79, 293.69, 295.09, ..., 295.29, 295.09, 294.69],
        [296.09, 296.89, 297.19, ..., 295.69, 295.69, 295.19],
        [297.69, 298.09, 298.09, ..., 296.49, 296.19, 295.69]]],
      shape=(2920, 25, 53))
# what is the type of the underlying data
type(da.data)
numpy.ndarray
Review#
Two of Xarray’s main data structures are:
DataArraysthat wrap underlying data containers (e.g. numpy arrays) and contain associated metadataDatasetsthat are dictionary-like containers of DataArrays
DataArrays contain underlying arrays and associated metadata:
Name
Dimension names
Coordinate variables
and arbitrary attributes.
Exercise#
In this exercise the air dataset has been deconstructed into a dictionary of NumPy arrays. Please
Build a Dataset from scratch from this dictionary of NumPy arrays.
Hint: You will want to start by building DataArrays, then combining them into a Dataset.
def air_as_dictionary():
    ds = xr.tutorial.open_dataset("air_temperature")
    return {
        "lat": ds["lat"].values,
        "lon": ds["lon"].values,
        "attrs": ds.attrs,
        "time": ds["time"].values,
        "air-temp": ds["air"].values,
    }


data = air_as_dictionary()


# Your code here
Why Xarray?#
Metadata provides context and provides code that is more legible. This reduces the likelihood of errors from typos and makes analysis more intuitive and fun!
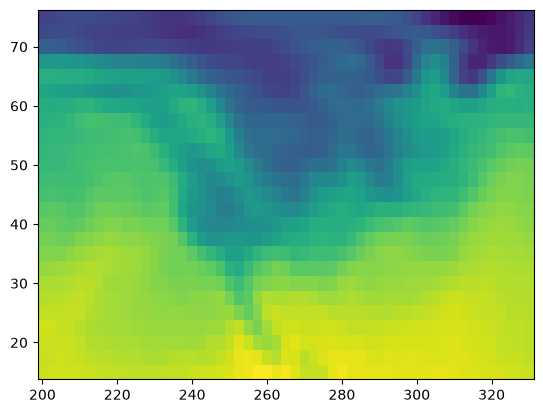
Analysis without xarray: X(#
# plot the first timestep
lat = ds.air.lat.data  # numpy array
lon = ds.air.lon.data  # numpy array
temp = ds.air.data  # numpy array
plt.figure()
plt.pcolormesh(lon, lat, temp[0, :, :]);
temp.mean(axis=1) ## what did I just do? I can't tell by looking at this line.
array([[279.398 , 279.6664, 279.6612, ..., 279.9508, 280.3152, 280.6624],
       [279.0572, 279.538 , 279.7296, ..., 279.7756, 280.27  , 280.7976],
       [279.0104, 279.2808, 279.5508, ..., 279.682 , 280.1976, 280.814 ],
       ...,
       [279.63  , 279.934 , 280.534 , ..., 279.802 , 280.346 , 280.778 ],
       [279.398 , 279.666 , 280.318 , ..., 279.766 , 280.342 , 280.834 ],
       [279.27  , 279.354 , 279.882 , ..., 279.426 , 279.97  , 280.482 ]],
      shape=(2920, 53))
Analysis with xarray =)#
How readable is this code?
ds.air.isel(time=0).plot(x="lon");
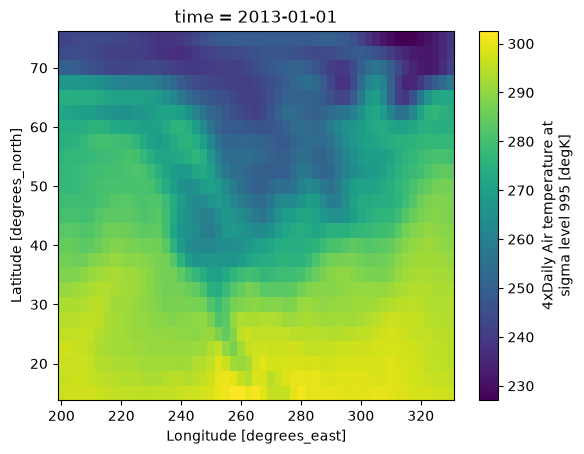
Use dimension names instead of axis numbers
ds.air.mean(dim="time").plot(x="lon")
<matplotlib.collections.QuadMesh at 0x7f09c306e850>
Extracting data or “indexing”#
Xarray supports
label-based indexing using
.selposition-based indexing using
.isel
See the user guide for more.
Label-based indexing#
Xarray inherits its label-based indexing rules from pandas; this means great support for dates and times!
# here's what ds looks like
ds
<xarray.Dataset> Size: 31MB
Dimensions:  (time: 2920, lat: 25, lon: 53)
Coordinates:
  * time     (time) datetime64[ns] 23kB 2013-01-01 ... 2014-12-31T18:00:00
  * lat      (lat) float32 100B 75.0 72.5 70.0 67.5 65.0 ... 22.5 20.0 17.5 15.0
  * lon      (lon) float32 212B 200.0 202.5 205.0 207.5 ... 325.0 327.5 330.0
Data variables:
    air      (time, lat, lon) float64 31MB 241.2 242.5 243.5 ... 296.2 295.7
Attributes:
    Conventions:  COARDS
    title:        4x daily NMC reanalysis (1948)
    description:  Data is from NMC initialized reanalysis\n(4x/day).  These a...
    platform:     Model
references: http://www.esrl.noaa.gov/psd/data/gridded/data.ncep.reanaly...# pull out data for all of 2013-May
ds.sel(time="2013-05")
<xarray.Dataset> Size: 1MB
Dimensions:  (time: 124, lat: 25, lon: 53)
Coordinates:
  * time     (time) datetime64[ns] 992B 2013-05-01 ... 2013-05-31T18:00:00
  * lat      (lat) float32 100B 75.0 72.5 70.0 67.5 65.0 ... 22.5 20.0 17.5 15.0
  * lon      (lon) float32 212B 200.0 202.5 205.0 207.5 ... 325.0 327.5 330.0
Data variables:
    air      (time, lat, lon) float64 1MB 259.2 259.3 259.1 ... 297.6 297.5
Attributes:
    Conventions:  COARDS
    title:        4x daily NMC reanalysis (1948)
    description:  Data is from NMC initialized reanalysis\n(4x/day).  These a...
    platform:     Model
references: http://www.esrl.noaa.gov/psd/data/gridded/data.ncep.reanaly...# demonstrate slicing
ds.sel(time=slice("2013-05", "2013-07"))
<xarray.Dataset> Size: 4MB
Dimensions:  (time: 368, lat: 25, lon: 53)
Coordinates:
  * time     (time) datetime64[ns] 3kB 2013-05-01 ... 2013-07-31T18:00:00
  * lat      (lat) float32 100B 75.0 72.5 70.0 67.5 65.0 ... 22.5 20.0 17.5 15.0
  * lon      (lon) float32 212B 200.0 202.5 205.0 207.5 ... 325.0 327.5 330.0
Data variables:
    air      (time, lat, lon) float64 4MB 259.2 259.3 259.1 ... 299.5 299.7
Attributes:
    Conventions:  COARDS
    title:        4x daily NMC reanalysis (1948)
    description:  Data is from NMC initialized reanalysis\n(4x/day).  These a...
    platform:     Model
references: http://www.esrl.noaa.gov/psd/data/gridded/data.ncep.reanaly...ds.sel(time="2013")
<xarray.Dataset> Size: 15MB
Dimensions:  (time: 1460, lat: 25, lon: 53)
Coordinates:
  * time     (time) datetime64[ns] 12kB 2013-01-01 ... 2013-12-31T18:00:00
  * lat      (lat) float32 100B 75.0 72.5 70.0 67.5 65.0 ... 22.5 20.0 17.5 15.0
  * lon      (lon) float32 212B 200.0 202.5 205.0 207.5 ... 325.0 327.5 330.0
Data variables:
    air      (time, lat, lon) float64 15MB 241.2 242.5 243.5 ... 295.1 294.7
Attributes:
    Conventions:  COARDS
    title:        4x daily NMC reanalysis (1948)
    description:  Data is from NMC initialized reanalysis\n(4x/day).  These a...
    platform:     Model
references: http://www.esrl.noaa.gov/psd/data/gridded/data.ncep.reanaly...# demonstrate "nearest" indexing
ds.sel(lon=240.2, method="nearest")
<xarray.Dataset> Size: 607kB
Dimensions:  (time: 2920, lat: 25)
Coordinates:
  * time     (time) datetime64[ns] 23kB 2013-01-01 ... 2014-12-31T18:00:00
  * lat      (lat) float32 100B 75.0 72.5 70.0 67.5 65.0 ... 22.5 20.0 17.5 15.0
    lon      float32 4B 240.0
Data variables:
    air      (time, lat) float64 584kB 239.6 237.2 240.1 ... 294.8 296.9 298.4
Attributes:
    Conventions:  COARDS
    title:        4x daily NMC reanalysis (1948)
    description:  Data is from NMC initialized reanalysis\n(4x/day).  These a...
    platform:     Model
references: http://www.esrl.noaa.gov/psd/data/gridded/data.ncep.reanaly...# "nearest indexing at multiple points"
ds.sel(lon=[240.125, 234], lat=[40.3, 50.3], method="nearest")
<xarray.Dataset> Size: 117kB
Dimensions:  (time: 2920, lat: 2, lon: 2)
Coordinates:
  * time     (time) datetime64[ns] 23kB 2013-01-01 ... 2014-12-31T18:00:00
  * lat      (lat) float32 8B 40.0 50.0
  * lon      (lon) float32 8B 240.0 235.0
Data variables:
    air      (time, lat, lon) float64 93kB 268.1 283.0 265.5 ... 256.8 268.6
Attributes:
    Conventions:  COARDS
    title:        4x daily NMC reanalysis (1948)
    description:  Data is from NMC initialized reanalysis\n(4x/day).  These a...
    platform:     Model
references: http://www.esrl.noaa.gov/psd/data/gridded/data.ncep.reanaly...Position-based indexing#
This is similar to your usual numpy array[0, 2, 3] but with the power of named
dimensions!
ds.air.data[0, 2, 3]
np.float64(247.5)
# pull out time index 0, lat index 2, and lon index 3
ds.air.isel(time=0, lat=2, lon=3)  #  much better than ds.air[0, 2, 3]
<xarray.DataArray 'air' ()> Size: 8B
array(247.5)
Coordinates:
    lat      float32 4B 70.0
    lon      float32 4B 207.5
    time     datetime64[ns] 8B 2013-01-01
Attributes:
    long_name:       4xDaily Air temperature at sigma level 995
    units:           degK
    precision:       2
    GRIB_id:         11
    GRIB_name:       TMP
    var_desc:        Air temperature
    dataset:         NMC Reanalysis
    level_desc:      Surface
    statistic:       Individual Obs
    parent_stat:     Other
    actual_range:    [185.16 322.1 ]
who_is_awesome: xarray# demonstrate slicing
ds.air.isel(lat=slice(10))
<xarray.DataArray 'air' (time: 2920, lat: 10, lon: 53)> Size: 12MB
array([[[241.2 , 242.5 , 243.5 , ..., 232.8 , 235.5 , 238.6 ],
        [243.8 , 244.5 , 244.7 , ..., 232.8 , 235.3 , 239.3 ],
        [250.  , 249.8 , 248.89, ..., 233.2 , 236.39, 241.7 ],
        ...,
        [274.79, 275.2 , 275.6 , ..., 277.2 , 277.  , 277.  ],
        [275.9 , 276.9 , 276.9 , ..., 280.9 , 280.5 , 279.7 ],
        [276.7 , 277.4 , 277.7 , ..., 283.29, 284.1 , 283.9 ]],

       [[242.1 , 242.7 , 243.1 , ..., 232.  , 233.6 , 235.8 ],
        [243.6 , 244.1 , 244.2 , ..., 231.  , 232.5 , 235.7 ],
        [253.2 , 252.89, 252.1 , ..., 230.8 , 233.39, 238.5 ],
        ...,
        [274.  , 274.4 , 275.1 , ..., 280.1 , 280.7 , 280.79],
        [275.6 , 276.1 , 276.29, ..., 280.6 , 282.  , 282.9 ],
        [275.79, 276.  , 276.5 , ..., 282.9 , 284.1 , 285.29]],

       [[242.3 , 242.2 , 242.3 , ..., 234.3 , 236.1 , 238.7 ],
        [244.6 , 244.39, 244.  , ..., 230.3 , 232.  , 235.7 ],
        [256.2 , 255.5 , 254.2 , ..., 231.2 , 233.2 , 238.2 ],
        ...,
...
        [275.79, 276.29, 277.39, ..., 274.99, 275.79, 277.09],
        [277.99, 278.49, 278.69, ..., 274.59, 275.59, 276.69],
        [277.49, 277.59, 278.19, ..., 274.89, 276.59, 278.19]],

       [[245.79, 244.79, 243.49, ..., 243.29, 243.99, 244.79],
        [249.89, 249.29, 248.49, ..., 241.29, 242.49, 244.29],
        [262.39, 261.79, 261.29, ..., 240.49, 243.09, 246.89],
        ...,
        [275.59, 276.29, 277.49, ..., 275.19, 275.79, 276.59],
        [276.89, 277.89, 278.69, ..., 273.59, 274.29, 275.29],
        [276.79, 277.29, 278.29, ..., 274.19, 275.39, 276.89]],

       [[245.09, 244.29, 243.29, ..., 241.69, 241.49, 241.79],
        [249.89, 249.29, 248.39, ..., 239.59, 240.29, 241.69],
        [262.99, 262.19, 261.39, ..., 239.89, 242.59, 246.29],
        ...,
        [274.29, 274.49, 275.59, ..., 274.69, 274.99, 275.39],
        [276.79, 277.49, 277.99, ..., 273.19, 273.59, 274.19],
        [276.89, 277.29, 277.59, ..., 273.79, 274.99, 276.19]]],
      shape=(2920, 10, 53))
Coordinates:
  * time     (time) datetime64[ns] 23kB 2013-01-01 ... 2014-12-31T18:00:00
  * lat      (lat) float32 40B 75.0 72.5 70.0 67.5 65.0 62.5 60.0 57.5 55.0 52.5
  * lon      (lon) float32 212B 200.0 202.5 205.0 207.5 ... 325.0 327.5 330.0
Attributes:
    long_name:       4xDaily Air temperature at sigma level 995
    units:           degK
    precision:       2
    GRIB_id:         11
    GRIB_name:       TMP
    var_desc:        Air temperature
    dataset:         NMC Reanalysis
    level_desc:      Surface
    statistic:       Individual Obs
    parent_stat:     Other
    actual_range:    [185.16 322.1 ]
who_is_awesome: xarrayOther field DataStructures#
Link to next notebook: Data structures In Biology
Exercise#
Dataset of non-alignable data.
For this exercise we will be using the "precipitation" example data. This data has two parts observed rainfall (observed), and predicted rainfall, on a different lat-lon grid. The next cell calls a function that will give you two different Datasets. Try to combine them using the tools we’ve discussed thus far and observe what goes wrong.
tree = xr.tutorial.open_datatree("precipitation.nc4")
reanalysis = xr.Dataset(tree["observed"])
observed = xr.Dataset(tree["reanalysis"])
For more see the user guide, the gallery, and the tutorial material.