Datasets in other fields#
While there are many Xarray examples from geosciences the Xarray data model is not constrained to that field. Our examples so far solve problems that are highly analogous to the problems faced in biology. In this notebook we will load a dataset based on the cells3d dataset from scikit-image.
import xarray as xr
Loading the Dataset#
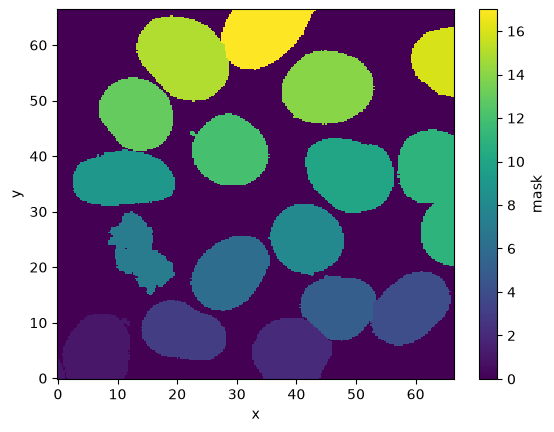
This dataset follows a classic pattern in microscopy where we have a stack of images, with two fluoresence channels. In addition to that we have a mask (or labels layer) that identifies individual cells
ds = xr.tutorial.load_dataset("cells3d")
ds
<xarray.Dataset> Size: 16MB
Dimensions:  (z: 60, c: 2, y: 256, x: 256)
Coordinates:
  * z        (z) float64 480B 0.0 0.26 0.52 0.78 ... 14.56 14.82 15.08 15.34
  * c        (c) <U8 64B 'membrane' 'nuclei'
  * y        (y) float64 2kB 0.0 0.26 0.52 0.78 1.04 ... 65.52 65.78 66.04 66.3
  * x        (x) float64 2kB 0.0 0.26 0.52 0.78 1.04 ... 65.52 65.78 66.04 66.3
Data variables:
    images   (z, c, y, x) uint16 16MB 2060 2058 2126 2087 ... 4979 6781 4031
    mask     (y, x) int32 262kB 1 1 1 1 1 0 0 1 1 1 1 ... 0 0 0 0 0 0 0 0 0 0 0
Attributes: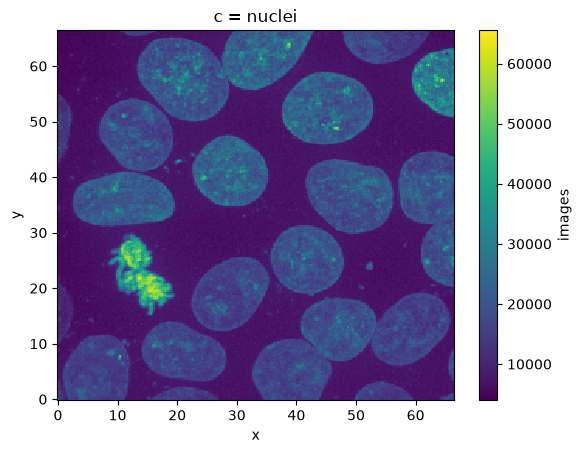
length: micronds["images"].max("z").sel(c="nuclei").plot()
<matplotlib.collections.QuadMesh at 0x7f5d10bccad0>
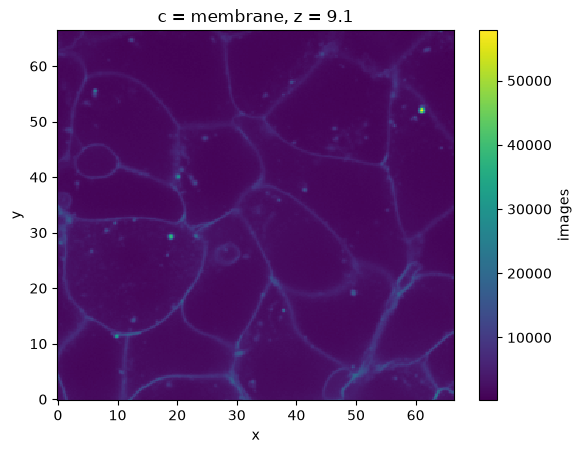
ds["images"].sel(z=9, method="nearest").sel(c="membrane").plot()
<matplotlib.collections.QuadMesh at 0x7f5d10a9f610>
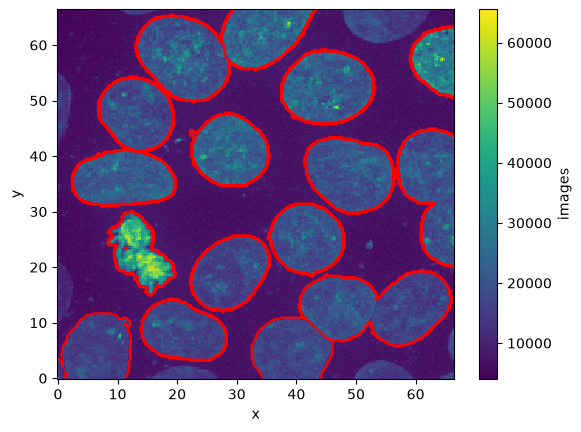
<matplotlib.contour.QuadContourSet at 0x7f5d109c8440>
ds["mask"].plot()
<matplotlib.collections.QuadMesh at 0x7f5d057f8a50>
Allows high level computations.#
We won’t get into here - but this structuring data allows you to leverage Xarray to do powerful operations such as computing per cell properties. See the Computational Patterns Notebook for more.