xarray.DataTree and hierarchical data#
In this lesson, we will learn how to use xarray.DataTree with hierarchical data. By the end of the lesson, we will be able to:
Learning Goals
Understand a basic
DataTreestructure (nodes, parents and children)Selecting
DataTreeUnderstand coordinate inheritance :::
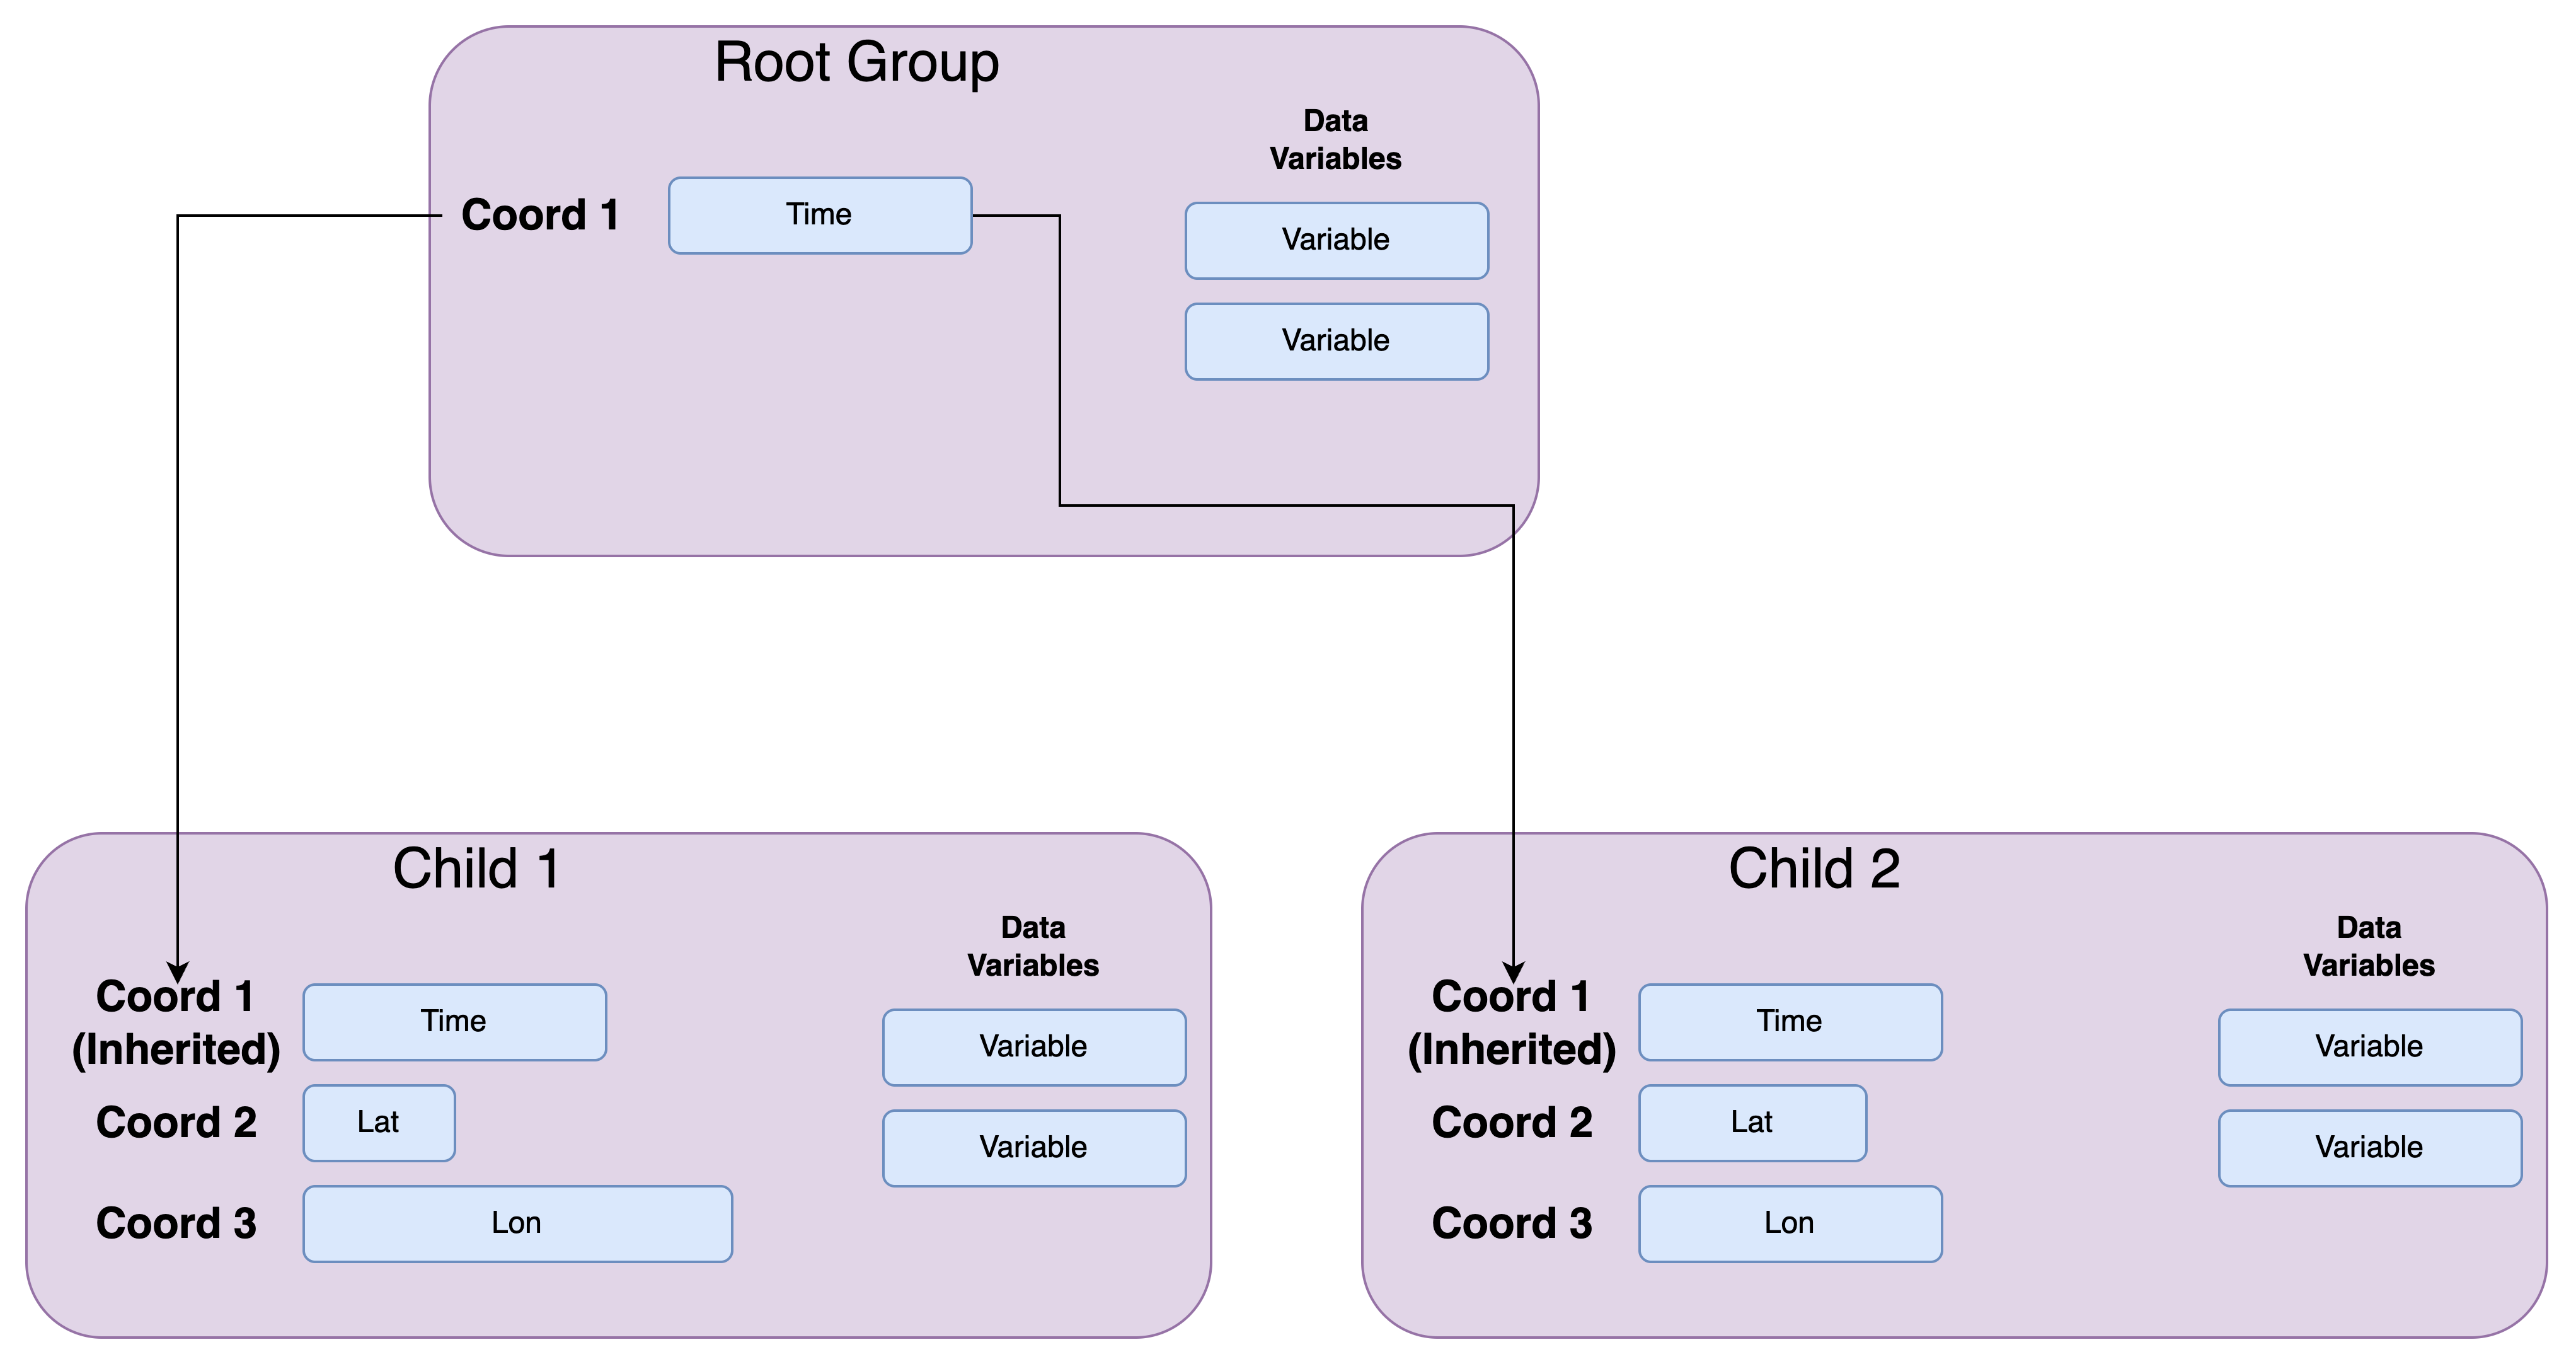
What is a DataTree#
Example DataTree 1#
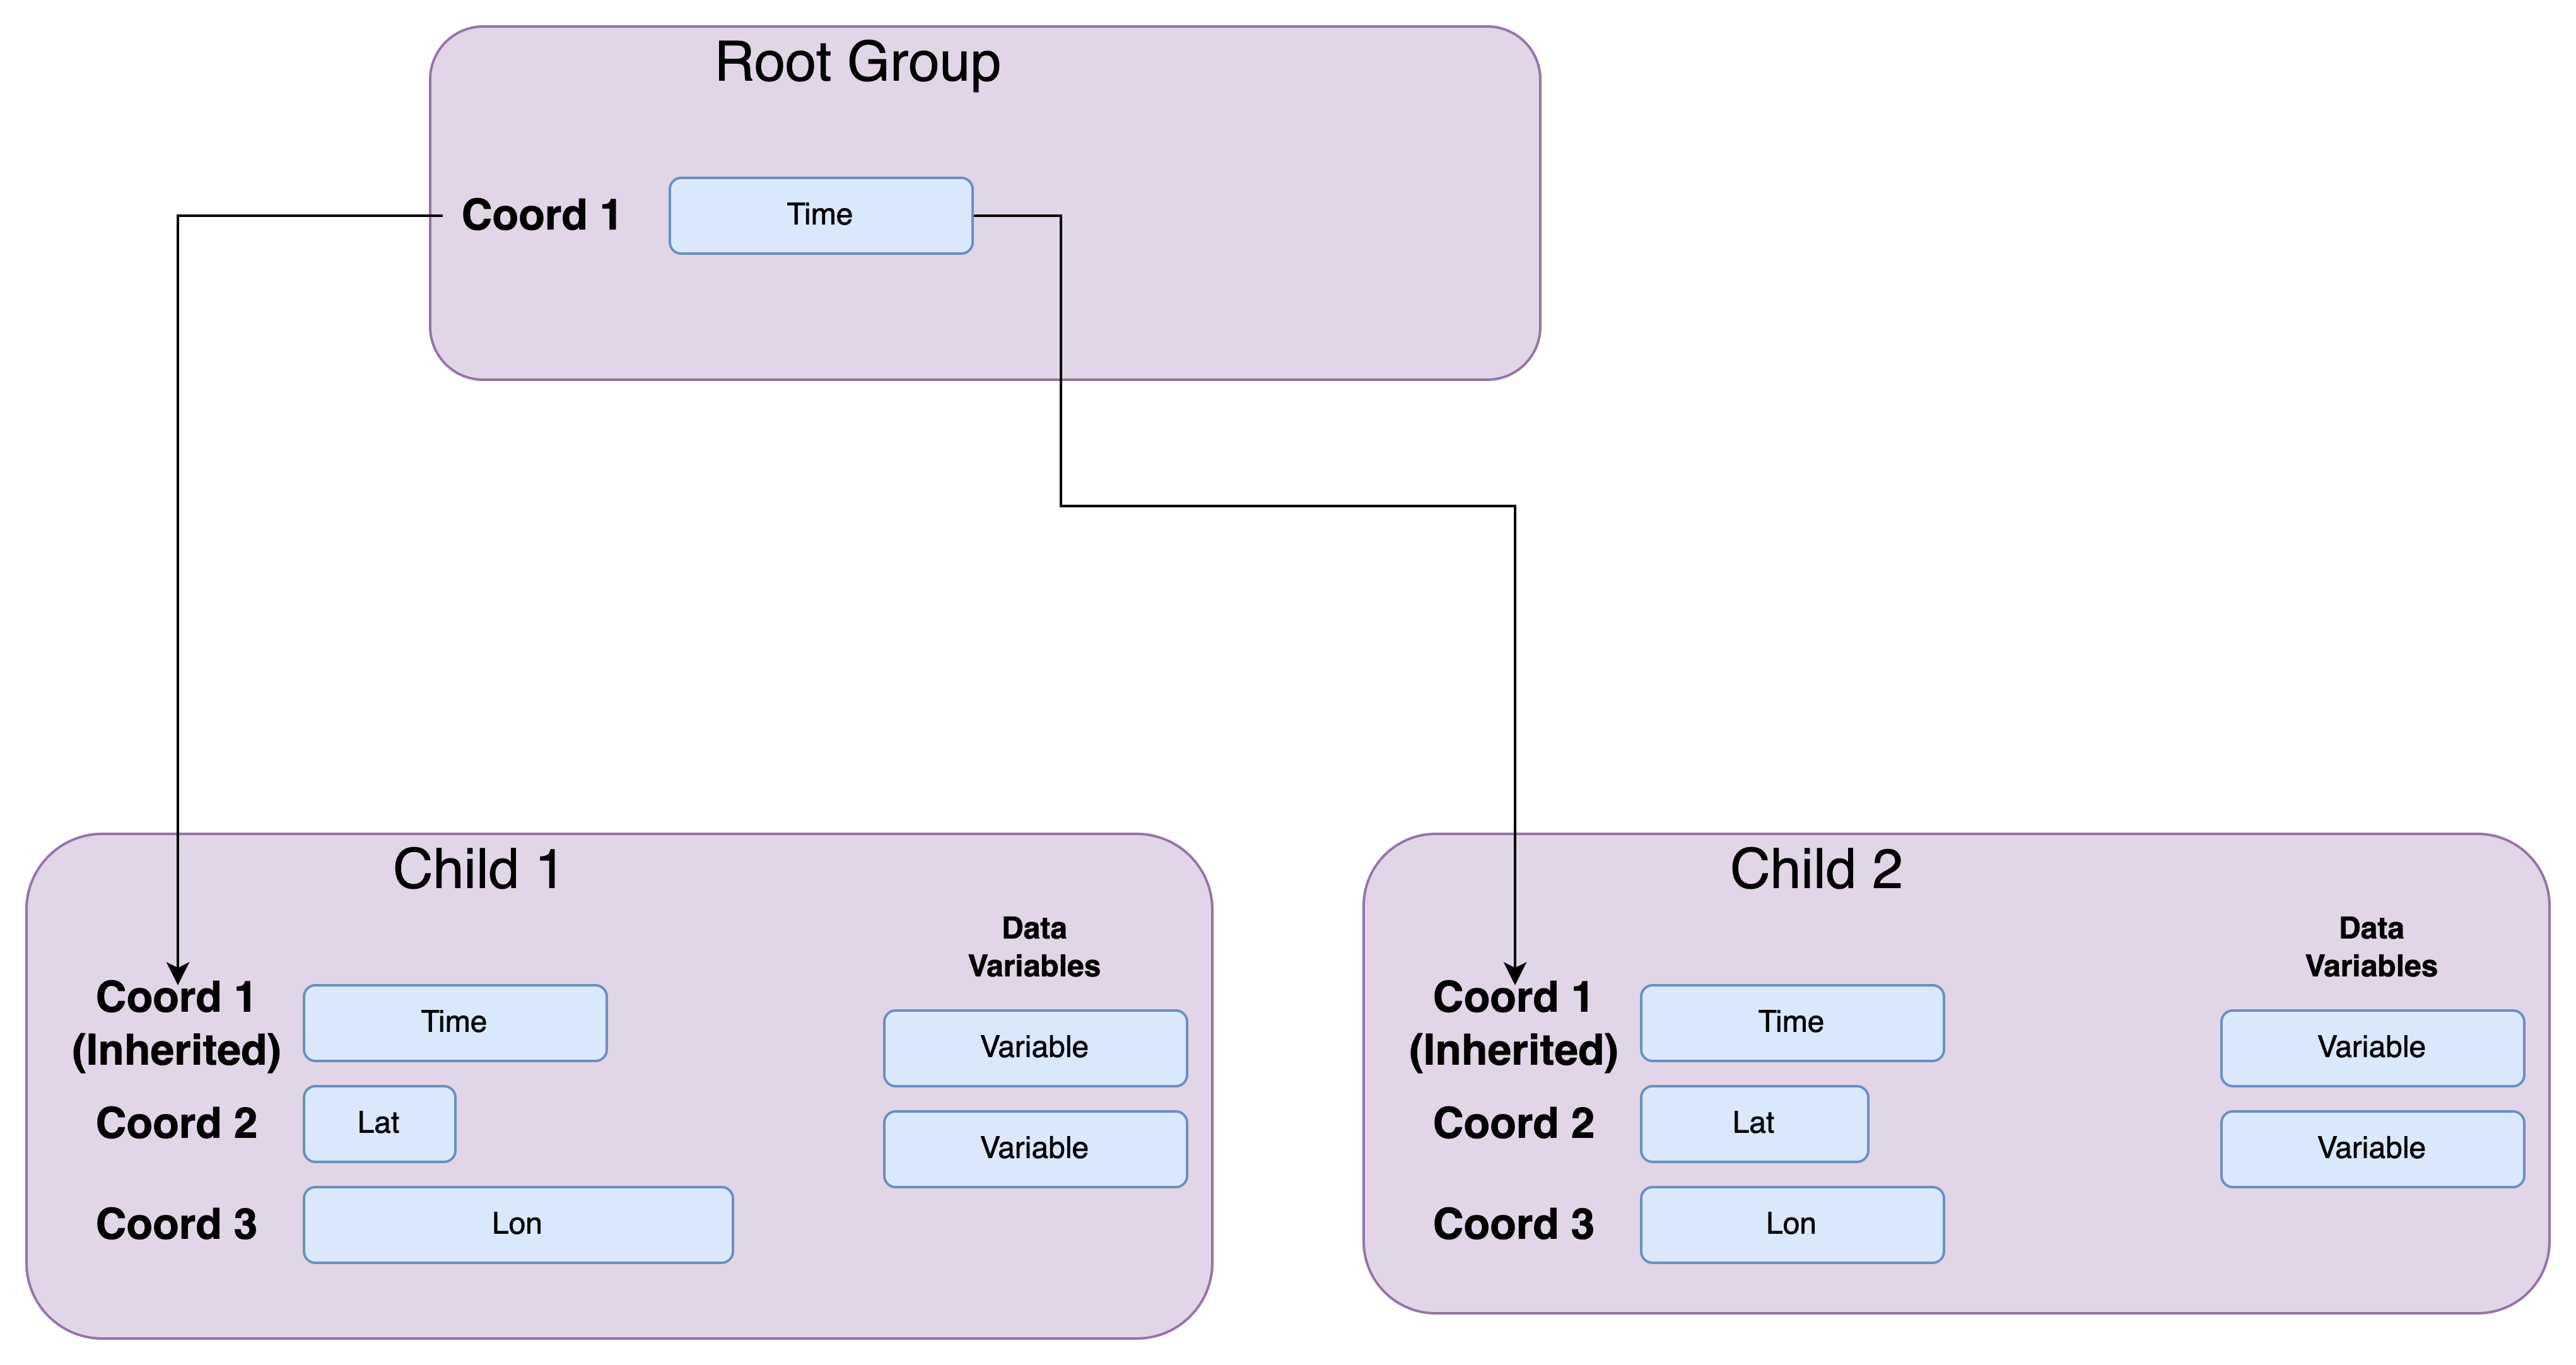
Example DataTree 2#
import xarray as xr
Opening a dataset with open_datatree()#
Let’s open up a precipitation dataset. This dataset was derived from “GPM_3IMERGHH_07” and “M2T1NXFLX_5.12.4” products.
precipitation = xr.tutorial.open_datatree("precipitation.nc4")
Nodes#
Groups in a netcdf4 or hdf5 file in the DataTree model are represented as “nodes” in the DataTree model.
We can list all of the groups with .groups
precipitation.groups
('/', '/observed', '/reanalysis')
Accessing variables in a nested groups#
Nested variables and groups can be accessed with either dict-like syntax or method based syntax.
precipitation["observed"]

# Returns a DataTree object, containing the variables, dimensions, and coordinates in the "observed" node
<xarray.DataTree 'observed'>
Group: /observed
    Dimensions:        (time: 10, lon: 320, lat: 150)
    Coordinates:
      * lon            (lon) float32 1kB -109.9 -109.8 -109.8 ... -78.15 -78.05
      * lat            (lat) float32 600B 20.05 20.15 20.25 ... 34.75 34.85 34.95
    Inherited coordinates:
      * time           (time) datetime64[ns] 80B 2021-08-29T07:30:00 ... 2021-08-...
    Data variables:
precipitation (time, lon, lat) float32 2MB ...precipitation["/observed/precipitation"]
<xarray.DataArray 'precipitation' (time: 10, lon: 320, lat: 150)> Size: 2MB
[480000 values with dtype=float32]
Coordinates:
* time (time) datetime64[ns] 80B 2021-08-29T07:30:00 ... 2021-08-29T16:...
* lon (lon) float32 1kB -109.9 -109.8 -109.8 ... -78.25 -78.15 -78.05
* lat (lat) float32 600B 20.05 20.15 20.25 20.35 ... 34.75 34.85 34.95
Attributes:
LongName: \nComplete merged microwave-infrared (gauge-adjusted)\...
Units: mm/hr
units: mm/hr
CodeMissingValue: -9999.9
DimensionNames: time,lon,latprecipitation.reanalysis.precipitation
# Method based syntax
<xarray.DataArray 'precipitation' (time: 10, lat: 31, lon: 52)> Size: 64kB [16120 values with dtype=float32] Coordinates: * time (time) datetime64[ns] 80B 2021-08-29T07:30:00 ... 2021-08-29T16:... * lat (lat) float64 248B 20.0 20.5 21.0 21.5 22.0 ... 33.5 34.0 34.5 35.0 * lon (lon) float64 416B -110.0 -109.4 -108.8 ... -79.38 -78.75 -78.12
Get the parent and child nodes from a group#
precipitation["reanalysis"].parent
<xarray.DataTree>
Group: /
│ Dimensions: (time: 10)
│ Coordinates:
│ * time (time) datetime64[ns] 80B 2021-08-29T07:30:00 ... 2021-08-29T16:...
├── Group: /observed
│ Dimensions: (time: 10, lon: 320, lat: 150)
│ Coordinates:
│ * lon (lon) float32 1kB -109.9 -109.8 -109.8 ... -78.15 -78.05
│ * lat (lat) float32 600B 20.05 20.15 20.25 ... 34.75 34.85 34.95
│ Data variables:
│ precipitation (time, lon, lat) float32 2MB ...
└── Group: /reanalysis
Dimensions: (time: 10, lat: 31, lon: 52)
Coordinates:
* lat (lat) float64 248B 20.0 20.5 21.0 21.5 ... 34.0 34.5 35.0
* lon (lon) float64 416B -110.0 -109.4 -108.8 ... -78.75 -78.12
Data variables:
precipitation (time, lat, lon) float32 64kB ...precipitation.children
Frozen({'observed': <xarray.DataTree 'observed'>
Group: /observed
Dimensions: (time: 10, lon: 320, lat: 150)
Coordinates:
* lon (lon) float32 1kB -109.9 -109.8 -109.8 ... -78.15 -78.05
* lat (lat) float32 600B 20.05 20.15 20.25 ... 34.75 34.85 34.95
Inherited coordinates:
* time (time) datetime64[ns] 80B 2021-08-29T07:30:00 ... 2021-08-...
Data variables:
precipitation (time, lon, lat) float32 2MB ..., 'reanalysis': <xarray.DataTree 'reanalysis'>
Group: /reanalysis
Dimensions: (time: 10, lat: 31, lon: 52)
Coordinates:
* lat (lat) float64 248B 20.0 20.5 21.0 21.5 ... 34.0 34.5 35.0
* lon (lon) float64 416B -110.0 -109.4 -108.8 ... -78.75 -78.12
Inherited coordinates:
* time (time) datetime64[ns] 80B 2021-08-29T07:30:00 ... 2021-08-...
Data variables:
precipitation (time, lat, lon) float32 64kB ...})
Inheritance#
DataTree implements a simple inheritance mechanism. Coordinates, dimensions and their associated indices are propagated downward from the root node to all descendent nodes.
Let’s take a look at some inherited coordinates with our precipitation dataset
precipitation.time
<xarray.DataArray 'time' (time: 10)> Size: 80B
array(['2021-08-29T07:30:00.000000000', '2021-08-29T08:30:00.000000000',
       '2021-08-29T09:30:00.000000000', '2021-08-29T10:30:00.000000000',
       '2021-08-29T11:30:00.000000000', '2021-08-29T12:30:00.000000000',
       '2021-08-29T13:30:00.000000000', '2021-08-29T14:30:00.000000000',
       '2021-08-29T15:30:00.000000000', '2021-08-29T16:30:00.000000000'],
      dtype='datetime64[ns]')
Coordinates:
* time (time) datetime64[ns] 80B 2021-08-29T07:30:00 ... 2021-08-29T16:...The "time" dimension is defined at the root node of our dataset and is propagated downward to the “observed” and “reanalysis” group
precipitation.observed
<xarray.DataTree 'observed'>
Group: /observed
    Dimensions:        (time: 10, lon: 320, lat: 150)
    Coordinates:
      * lon            (lon) float32 1kB -109.9 -109.8 -109.8 ... -78.15 -78.05
      * lat            (lat) float32 600B 20.05 20.15 20.25 ... 34.75 34.85 34.95
    Inherited coordinates:
      * time           (time) datetime64[ns] 80B 2021-08-29T07:30:00 ... 2021-08-...
    Data variables:
precipitation (time, lon, lat) float32 2MB ...precipitation.reanalysis
<xarray.DataTree 'reanalysis'>
Group: /reanalysis
    Dimensions:        (time: 10, lat: 31, lon: 52)
    Coordinates:
      * lat            (lat) float64 248B 20.0 20.5 21.0 21.5 ... 34.0 34.5 35.0
      * lon            (lon) float64 416B -110.0 -109.4 -108.8 ... -78.75 -78.12
    Inherited coordinates:
      * time           (time) datetime64[ns] 80B 2021-08-29T07:30:00 ... 2021-08-...
    Data variables:
precipitation (time, lat, lon) float32 64kB ...Review#
Example DataTree 1#
Example DataTree 2#
Exercises#
Make a plot of plot of the Oberserved and Predicted precipitation
Think through if there are datasets from your field