
Create your own Xarray Backend#
In this lesson, we will learn about and how to create your own custom xarray backend
Learning Goals
Learn about xarray’s support for custom backends
Learn how to use a custom
imageiobackend to open and manipulate GIFsLearn how to extend the
imagegiobackend to write out a GIF
Why should you create your own Xarray backend?#
Allows you to use xarray’s interface
Attribute-like syntax, dict-like syntax and label based indexing
You don’t need to integrate any code in Xarray
Easy and fast!
Setting up the BackendEntrypoint#
To set up a BackendEntrypoint we can implement a subclass of BackendEntrypoint and expose the open_dataset method to it. For this tutorial we have the ImageIOBackend already defined but we will extend the functionally to write GIFS.
image_path = "io.gif"
We can write a simple image reader function that we can then plug into our MyBackendEntrypoint class. For this example we are going to use imageio an image reader and writer library. With imageio you can read an image file with iio.imopen
Note
The ImageIOBackend also defines a ImageIOBackendArray with basic indexing.
:
import imageio as iio
from xarray.backends import BackendEntrypoint


def imageio_open(
    filename_or_obj,
):
    img = iio.imopen(filename_or_obj, io_mode="r")
    return img.read()


imageio_open(image_path)


class MyImageReader(BackendEntrypoint):
    def open_dataset(
        self,
        filename_or_obj,
        *,
        drop_variables=None,
    ):
        return imageio_open(filename_or_obj)
Reading image data#
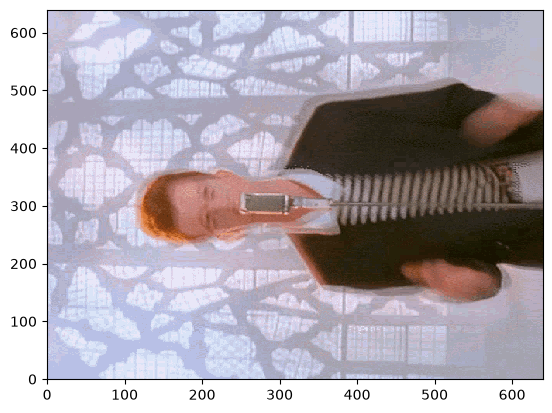
Lets use our ImageIOBackend to open a GIF.
import xarray as xr
from imageio_ import ImageIOBackend

gif_ds = xr.open_dataset(image_path, engine=ImageIOBackend)
gif_ds
<xarray.Dataset> Size: 66MB
Dimensions:  (time: 54, height: 640, width: 640, color: 3)
Coordinates:
  * time     (time) timedelta64[ms] 432B 00:00:00 ... 00:00:02.120000
  * color    (color) <U5 60B 'red' 'green' 'blue'
Dimensions without coordinates: height, width
Data variables:
data (time, height, width, color) uint8 66MB ...Examining our image dataset#
Since our image is a Dataset object we can use xarray’s interface for Dataset objects.
Let’s try listing all of the variables, dimensions and selecting data
gif_ds.variables
Frozen({'data': <xarray.Variable (time: 54, height: 640, width: 640, color: 3)> Size: 66MB
[66355200 values with dtype=uint8]
Attributes:
loop: 0, 'time': <xarray.IndexVariable 'time' (time: 54)> Size: 432B
array([   0,   40,   80,  120,  160,  200,  240,  280,  320,  360,  400,  440,
        480,  520,  560,  600,  640,  680,  720,  760,  800,  840,  880,  920,
        960, 1000, 1040, 1080, 1120, 1160, 1200, 1240, 1280, 1320, 1360, 1400,
       1440, 1480, 1520, 1560, 1600, 1640, 1680, 1720, 1760, 1800, 1840, 1880,
1920, 1960, 2000, 2040, 2080, 2120], dtype='timedelta64[ms]'), 'color': <xarray.IndexVariable 'color' (color: 3)> Size: 60B
array(['red', 'green', 'blue'], dtype='<U5')})
We can list our dimensions
gif_ds.dims
FrozenMappingWarningOnValuesAccess({'time': 54, 'height': 640, 'width': 640, 'color': 3})
Let’s try getting our DataArray
gif_ds["data"]
<xarray.DataArray 'data' (time: 54, height: 640, width: 640, color: 3)> Size: 66MB
[66355200 values with dtype=uint8]
Coordinates:
  * time     (time) timedelta64[ms] 432B 00:00:00 ... 00:00:02.120000
  * color    (color) <U5 60B 'red' 'green' 'blue'
Dimensions without coordinates: height, width
Attributes:
loop: 0GIF metadata#
We can examine, update and add metadata to our Dataset object.
We can examine the attributes in our GIF “data” variable with the .attrs method
gif_ds.data.attrs
{'loop': 0}
Exercise#
Exercise
Can you add a new attribute to our GIF “data” variable called “fps”. This is the frames per second we can write our GIF to. You can set it to any value.
Solution
gif_ds.data.attrs['fps'] = 100
GIF writer#
We can extend our backend with an GIF writer. Here we use matplotlib’s animation functions and PillowWriter
import matplotlib.animation as animation
import matplotlib.pyplot as plt
from imageio_ import ImageIOBackend
from matplotlib.animation import PillowWriter


class SimpleImageWriter(ImageIOBackend):
    def to_giff(
        self,
        dataset,
        variable,
        time_dim,
        out_filename,
        **kwargs,
    ):
        fig, ax = plt.subplots()

        frames = []
        variable_da = dataset[variable]

        for time in variable_da[time_dim]:
            variable_da = variable_da.transpose("time", "width", "height", "color")
            to_plot = ax.pcolormesh(
                variable_da.height,
                variable_da.width,
                variable_da.sel(time=time),
                animated=True,
                shading="auto",
                **kwargs,
            )

            frames.append([to_plot])

        try:
            writer = PillowWriter(fps=variable_da.attrs["fps"], **kwargs)
        except KeyError:
            writer = PillowWriter(fps=50, **kwargs)

        ani = animation.ArtistAnimation(fig, frames, blit=True, repeat=True)
        ani.save(filename=out_filename, writer=writer)
img_writer = SimpleImageWriter()
img_writer.to_giff(gif_ds.compute(), "data", "time", "io_writer.gif")